Augmentez la puissance de votre surveillance. Pandora FMS s’intègre aux principales plateformes et solutions cloud.
Helpdesk puissant et flexible pour les équipes d’assistance et de service à la clientèle, aligné sur les processus de la bibliothèque d’infrastructure des technologies de l’information (ITIL).
An extensive collection from detailed guides that break down complex topics to insightful whitepapers that offer a deep dive into the technology behind our software.
Expande el poder de tu monitorización. Pandora FMS es flexible y se integra con las principales plataformas y soluciones en la nube.
Potente y Flexible Helpdesk para equipos de soporte y atención al cliente, alineado con los procesos de Biblioteca de Infraestructura de Tecnologías de Información (ITIL).
In Pandora FMS we are in luck, we now have Pandora FMS RHEL8 software certification.
Some called it impossible, others the next step to take, whatever the case everyone received it with applause!
But hold on…
What is Pandora FMS RHEL8 software certification?
This certification now features a set of executable tests for partners that produce results that are then reviewed by Red Hat.
Your non-containerized software is certified when test results show successful interoperability with Red Hat Enterprise Linux 8 in a safe and supportable manner using best practices.
Once verified, you can promote your product(s) in the Red Hat Ecosystem catalog.
In addition, Red Hat will grant partners a free limited subscription to TSANet for collaborative customer case management to improve their ongoing user experiences.
Does anyone give more?
Why Red Hat Enterprise Linux 8?
Well, because Red Hat Enterprise Linux, the industry leader in enterprise Linux deployments, is the foundation of Red Hat’s open hybrid cloud portfolio, providing the underlying engine for developing and deploying complex workloads across physical, virtual, private, and public cloud environments in a more secure and controlled way.
After just a few months, Red Hat Enterprise Linux 8 is already the number one RHEL version among developers, with hundreds of thousands of downloads.
*Don’t worry, if you need to learn more about RHEL 8, visit the developer page RHEL 8.
Certification Features
This new Red Hat Enterprise Linux software certification means that:
Our executable is verified with a Red Hat seal of approval.
Our products are differentiated by being more compatible, interoperable and safe.
We get a limited TSANet membership (courtesy of Red Hat) to improve your customers’ long-term support and experiences.
We get free technical support for the certification.
Benefits for partners
The benefits that partners receive from this certification include:
As you know, this summer half of Spain has been on drought alert. A consequence, without a doubt, of the extreme summer heat and rain scarcity.
Andalusia was one of the most affected.
Therefore, companies and public administrations in the area have raised the alarm. Especially because of environmental and economic effects.
Thank heaven and science, technology experts already point out some solutions to reduce the impact of this type of phenomenon.
Pandora FMS and drought monitoring
Nowadays, many cities go for digital and technological help to improve resource management.
One of the most popular practices among companies is monitoring. It is known that this can work, without a doubt, as a defense against catastrophes such as the one that devastated Andalusia this summer.
“Monitoring systems improve the effectiveness of any workforce. And, therefore, their resource management.”
Indicates Sancho Lerena, general director of the monitoring company Pandora FMS.
“Monitoring how reservoirs are falling, the level of rainfall compared to the usual figures, or even finding out whether household water consumption is increasing significantly can help anticipate scenarios such as the current lack of water.”
This type of approach, monitoring, is increasingly used. For now public administrations are adapting, but this is already something common in the business field.
Monitoring can reduce the workload in the retail sector by 30%. In addition, it can triple the response time to citizen service. Which, frankly, would be very good for any public administration.
Andalusia and its battle against drought
Andalusia has already referred to the year 2022 as one of the driest of the last 50 years.
The Doñana National Park has been one of the most affected scenarios, along with the rest of the reference reservoirs, which are below 11% of flow.
These circumstances are also having a negative economic impact. For the time being, olive oil production in 2022 is expected to be reduced by 50%. The poorest year of the last decade, compared to over one million tons in 2021.
But initiatives to alleviate these problems have already been set in motion, many of them proving the effectiveness of monitoring.
Malaga, just as any other example, has recently started a test project to monitor the operation of the counters of 8,000 households with older residents or dependents. The administration will be able to identify strange behaviors through this method. Such as families with long periods of inactivity in water consumption or households in which an increase in consumption may be a sign of a resident accident.
And the CSIC is leading a different case focused exclusively on environmental control. A monitoring system that analyzes meteorological drought nationwide, providing experts with additional information to predict the phenomena of the coming months.
This is where Pandora FMS is proposed as the key to measure, for example, how widespread water use is in particular months and therefore predict some measures in case a drought is foreseen during the year.
Let’s check out together the features and improvements included in the new Pandora FMS release: Pandora FMS 765.
What’s new in the latest Pandora FMS release, Pandora FMS 765
NEW FEATURES AND IMPROVEMENTS
Improved network maps
Multiple changes have been made to network maps to improve the usability, performance and network map setup.
Map drawing and refreshing is automatic and dynamically reflects the changes in the network, highly improving the existing display in previous versions.
The possibility of deleting “Pandora FMS” node as well as all its relationships has been added. Usability has also been improved in manual relationship management between nodes.
Added linking between network maps. When there is a dummy node pointing to another network map, it will be possible to access that map from the options of the dummy node.
New report type: System module inventory
The new type of report “System module inventory” has been created, through which you will see an inventory of the modules generated in your Pandora FMS installation registered by module name, remarking the necessary information for those modules that have the same module name.
Sending reports by mail as an alert action
A new feature has been added to Pandora FMS alert system whereby it is possible to send reports by email in PDF thanks to its incorporation as new actions/commands within Pandora FMS.
Support for Ubuntu 22.04
Ubuntu 22.04 is officially supported by Pandora FMS server
New scheduled downtime option. Disable modules
A new feature has been added within the scheduled downtimes. Now you may choose the option to disable modules without stopping the agent itself.
History database in Metaconsole
Just as it existed in Pandora FMS nodes, there is now the possibility of having a history database within the Metaconsole.
Pandora WMIC package for ARM systems
Usage in ARM environments is growing, and we have created an ARM-supported binary for environments that use the Satellite to remotely monitor Windows environments.
IP console access control
Different users requested to control access to the console by source IP, which can be defined individually by user. We implemented it so that masks can also be defined, e.g.: 192.168.100.*
Plugin with which emails can be filtered or the number of emails of an account through a series of filters. Useful for detecting whether an alert email arrived or to look for a certain email.
Plugin with which to monitor a space of names of Event Hubs. It returns several types of metric, like SuccesfulRequests, CapturedBytes or ActiveConnections.
Plugin with which to monitor an Azure PostgreSQL data server and to receive metrics such as cpu_precent, memory_percent, storage_used or active_connections, among others.
Pandora FMS, an international benchmark in system monitoring, becomes technology partner of the French company M81.
The French platform has extensive experience in the sector since its creation in 1988 and is currently considered one of the great experts when it comes to monitoring IBM i systems.
Thanks to this agreement, Pandora FMS will transfer this type of solutions to Spanish companies to improve IT management and the efficiency of the different work areas.
Pandora FMS and the French company M81 become partners
The alliance between Pandora FMS and M81 represents a notable developing point in the Spanish technology sector, since in recent decades no national company had been able to count on monitoring solutions for IBM i systems.
Formerly known as AS400, it is widespread among big companies with IT infrastructures that deal with large amounts of data.
The M81 monitoring software for IBM i, considered a legacy or outdated system, allows to improve the efficiency of the resources of companies that are based on large IT infrastructures.
In addition to increasing the ability to manage and organize internal data, it saves time for employees, who can devote their efforts to other company areas.
M81 was founded in 1988
Since then, it has been developing solutions for IBM i to become one of the world’s leading experts in these systems.
The French company works for large insurance companies such as the American Marsh & McLennan or AXA, for banks such as the German DZ Bank or the Portuguese Caixa Geral de Depósitos; for companies in the industry such as ArcelorMittal (considered the largest steelmaker in the world) and for logistics companies such as Heppner.
In addition, it is also established in the pharmaceutical, luxury and oil sectors.
The M81 solution ranges from advanced monitoring to the recovery of failed databases.
Despite being aimed at performing very complex tasks, its implementation is characterized by its simplicity and easy handling for teams, achieving the objective of reducing the workload of the workforce and reorienting those efforts in areas most in need.
M81 and Pandora FMS
After the agreement reached with Pandora FMS, this type of technology will be available for large Spanish and international companies that continue to use the IBM i system, also known as AS400 and considered a legacy system.
“The agreement is not only good for our company, but it means ending decades of delay in the Spanish sector that works with IBM i Systems,” says Sancho Lerena, CEO of Pandora FMS.
The Spanish company, a specialist in system monitoring, has taken its solutions to international giants such as Rakuten, Toshiba or Repsol.
Also Spanish reference companies such as El Pozo or Prosegur, in addition to working for public administrations such as the EMT or the Digital Madrid area.
In total, more than 50,000 installations in 53 different countries, a figure that will continue increasing now following the agreement reached with M81.
“M81 is a reference company in the sector, so the alliance reached is a success. But, in addition, it means opening a window for opportunities for companies that have IBM i because they will be able to reduce costs and improve their management following the steps of the great international brands “, explains Lerena.
The technology company Pandora FMS, specialized in system monitoring, takes a step further towards growth becoming the first national technology capable of offering monitoring solutions, both for IBM i systems (formerly known as AS400) and for much more modern systems.
A development that, after several decades, means the full coexistence of IBM i with more recent systems.
PFMS and monitoring system integrated with IBM i
Pandora FMS, through the solution developed by the French company M81, will provide this service to multiple important customers.
*M8 developed monitoring software for IBM i.
After the agreement, Pandora FMS will be the first and only one in Spain to be able to combine solutions for both up-to-date systems and IBM i.
The agreement with M81 is a key alliance
The French company has been working in the sector since 1988, becoming one of the benchmarks both nationally and internationally.
In addition to being specialized in IBM i, they provide solutions such as database recovery after serious failures or advanced monitoring to improve IT team operations.
IBM i, also known as AS400, is a system considered as legacy or obsolete that has 34 years of history.
Its versions have been updated and improved throughout all this time. The evidence is that many multinationals keep it still in their structure.
The so-called IBM Power System and the IBM i operating system continue to be recognized, but IT managers and CEOs are choosing to work with open servers and operating systems that offer many possibilities available in the market.
Therefore, they stopped working with IBM Power System and IBM i.
Due to this legacy system status, companies that use IBM i recognize the need to develop their own verifications or buy solutions that improve their IT structure performance and optimize their costs.
Until now, they could only hire specialized monitoring systems as far as IBM is concerned.
However, after the development of Pandora FMS and M84, Spanish companies will be able to implement a single powerful monitoring system that combines the management of both newer systems and IBM i.
On a global scale
As a sign of the potential IBM i has, there are institutions such as the Government of Andorra that have this type of technology.
Although it is usually the financial and logistics sectors the ones that are managed the most through the old AS400, now known as IBM i.
Logistics giants such as Cargo Partner, banks such as DZ Bank or insurance companies such as Marsh & McLennan are some of the examples of large formations related to the world of IBM i.
Monitoring and growth
Monitoring, it should be remembered, is one of the bases of the efficient growth of any company today.
According to internal data from Pandora FMS, there are digital administrations that have improved their response time by 200%.
In the retail sector, the workload can be reduced by up to 30% thanks to resource optimization.
Percentages that translate into cost savings for large multinationals and, above all, IT resource optimization for other areas.
“From now on, Spanish companies that used IBM i will no longer have to acquire different monitoring services to be able to manage their entire infrastructure.
Thanks to the M81 software and its integration with Pandora FMS solution, a legacy system like IBM i will be easy to monitor like any other system,”
explains Sancho Lerena, CEO of Pandora FMS
“This also shows that the IT sector continues to grow in Spain.
Despite having waited for a long time, this development is a turning point for companies that still have systems, such as IBM i, which, despite being legacy, continue to have a lot of influence on IT management for the business of many companies,” highlights the chairman of the Spanish company.
Pandora FMS brings the Internet to 500,000 people in Brazil
The solution is part of the project Floresta Digital, whose objective is to bring free Internet connection to all citizens of the State.
In total, according to official calculations, there are more than 700,000 citizens distributed in 22 municipalities.
However, the first steps of the project are aimed at benefiting about half a million Brazilians.
Pandora FMS, whose global experience has led the Spanish company to work for brands such as Rakuten, Repsol or Toshiba, is responsible for developing the management and control of the network environment. That is, through the company’s solution, the Acre government can know through a single console the situation of its entire connection network.
For example, if it fails at some point or if there is some slowdown in connection speed.
“The peculiarity of this project is that the authorities of Acre have managed to develop this IT control with the free version ofPandora FMS.
The simplest but, despite this, efficient enough in fact to meet its objective”, recognizes Sancho Lerena, CEO of the Spanish company.
Pandora FMS system allows to monitor all the environment’s information.
That way, it is possible to have a broad vision of how the entire connection works, which areas are more critical and where any setback should be anticipated.
A monitoring that improves the performance both technologically and in economic terms.
The system park reaches 800 devices
The technology offered by the Spanish company allows one to see how the infrastructure is distributed and offers the ability to intervene quickly should there be any issue such as the high consumption of bandwidth in any location or the connection failure in any city.
In addition, the Brazilian administration has managed to reduce costs.
By having control and enough information about how all their technological deployment is working, it is possible to manage the workforce more efficiently.
They reduce unnecessary trips and, in turn, allowances and travel expenses to check the status of some connection point.
“The project to bring free internet to half a million people was already a challenge for Brazilian administrations.
Doing it initially with the free version of Pandora FMS added difficulty.
Despite everything, Acre’s teams have adapted to technology demonstrating that digital environments will be increasingly present in every public administration”, explains Sancho Lerena.
The work is hard and there are high expectations, but we don’t give up! The fight goes on and every day we are happier with what we achieve and what we mean to our users.
For that reason, we are proud to announce Pandora FMS as the winner of the Best Ease of Use 2022 badge in the Network Monitoring category, apart from being mentioned as Pop-up Favorite in the 2022 Server monitoring and APM Software Shortlist, a free online service that helps organizations find the right software. The world’s leading software review platform.
Pandora FMS is always among the favorites. Capterra knows this
*As many of you may already know, Capterra Shortlist is an independent assessment that evaluates user reviews and online search activity to generate a list of market leaders in the software space that offer the most popular solutions. (Have a look at the Capterra Shortlist methodology here.)
**Capterra, which together with Getapp and Software Advice is a platform owned by Gartner, once a year synthesizes reviews in a given software category to recognize the best rated products by users.
What are these mentions and badges that Capterra grants?
Best badges awarded by Capterra are a great way to show how a product competes with its rivals, based on positive reviews and feedback from users.
Reviews Badges serve as a strong element of trust for potential buyers when purchasing a product.
Best badges synthesize more than one million verified user reviews that span more than 750 software categories to recognize top-rated products.
Of course, the software companies and SaaS providers that get them often boast of these badges in social media, blogs, newsletters, press releases, websites and other marketing means. Of course that had to be our case too!:
As it could not be otherwise, our CEO and colleague Sancho Lerena has wanted to make some comments on this achievement:
“The first thing I would like to say is thank you. Sometimes it seems that one does not give enough thanks and there is much to thank, both to our coworkers and users, and even the Capterra platform itself.
Especially because there are so many contributions and because it is absolutely always a huge honor to receive this kind of mention.”
Here is a sample of our recognition in table format:
With an overall rating of 4.6 out 5, we received some stellar reviews on Capterra:
“For a long time, we were looking for a monitoring solution that could ensure the resiliency of our web applications and finally, with the help of the Pandora FMS team, we found the right tool.
Pandora FMS is an out-of-the-box monitoring solution that allows you to monitor your applications and systems and has a very intuitive interface that allows you to build your dashboards in no time. We can not wait to see what the future holds for Pandora FMS.”
The question now is, do you want to be the only one not to get on board with such a popular, effective and acclaimed product as Pandora FMS? As you see, you will hardly regret it! We’re counting on you!
Food retailers reduce the workload accumulated by their IT areas by almost 30% thanks to monitoring.
Controlling data and extensive information from the whole company, by controlling, supervising and ordering everything through the same system, allows to reduce the times of action in the face of possible errors and failures, improves resource management and organization and increases the effectiveness of the business activity.
In addition, monitoring saves costs.
IT monitoring and retailers, what you need to know
Large food distribution firms carry out continuous processes to guarantee the supply of products on the shelves, so the volume of information generated by executing these tasks throughout the day is remarkable.
If you add to that amount of data the diversity of systems in the IT structure with which retailers work on a daily basis, the route to obtain valuable, clear and practical information becomes even more complicated.
The difficulty is greater if, in order to analyze these data, there are unqualified personnel without the support of a reliable platform to make their work easier.
This situation highlights that the fact of not having a monitoring system multiplies the actions necessary to obtain information on the activity of the technological structure of the company or the state of each of its facilities:
This slows down a company’s power to act and its ability to react.
That, after all, translates into a loss of value both economically and in terms of performance, especially concerning the area of human resources.
What do we achieve with monitoring in the retail sector?
Through monitoring, it is possible to access, even remotely, the entire IT structure of a company.
That is, by means of a central console you may organize and control an entire technology park.
This, despite being able to present a heterogeneous panorama with a wide diversity of systems that sometimes do not support each other, goes under the command of a monitoring system by which it can be accessed.
Monitoring makes it possible to replace an existing system and it is also capable of coexisting with others.
The kind of flexibility that is essential in the sector, because it allows to integrate new stuff to the existing system.
This observability implies the ability to bring together all data sources and provide useful information for the company.
The more complex IT systems are, the more important it is to simplify their monitoring.
That way, servers from different operating systems can be monitored by the same controller.
And in turn, every time an error is detected anywhere in the park, the information can immediately reach those responsible, shortening the reaction time and anticipating more serious internal operating situations.
Monitoring, in addition to making control and error anticipation easier within the company’s performance, it also helps to find out aspects as simple as the state of the toner of a series of printers, or the time workers clocked in.
Monitoring companies ends up leading to cost savings and service improvement.
Thanks to appliying monitoring systems, retailers in the food sector acquire a tool that enhances the control of the technological infrastructure that guarantees the traceability of their products throughout the distribution chain; from its origin to its arrival to the final customer or to sales establishments.
In addition, the implementation of this data technology allows monitoring the status of the systems from a centralized position and anticipating breakdowns and errors, saving workload and improving delivery times.
In the food market there have already been companies that have opted for this development of their structures.
An example of this is Fripozo, belonging to the Fuertes Group, which implemented a monitoring system thanks to its agreement with the Spanish companyPandora FMS.
As a result of this adaptation, it achieved higher responsiveness to any system failure that could affect the control and distribution of deep-frozen food.
In this particular case, one of the concerns for the company was to achieve some degree of flexibility.
That is, that something specific could be monitored without this involving a large investment of time and local resources without external intervention.
Fripozo, after this association with Pandora FMS, managed to reach that goal.
In addition to Fripozo, other distributors such as Salvesen Logisticshave also confirmed operational improvements after monitoring their IT structure.
The company, which like Fripozo took its chances on the Spanish Pandora FMS, came to reveal a reduction of 24% of the workload of its IT area.
As revealed from their organization, the attention that was constantly paid to the health of the system was focused on improving services and products.
The sector, with more and more competition, is devoted to a necessary organization of the internal data that are produced throughout the same day in a company.
Any mistake can lead to a chain failure, a misuse of their own resources and a point in favor of competition in the market.
“The monitoring carried out by systems such as Pandora FMS represents clear economic savings for companies that implement it in their IT infrastructure. Reaction times to any failure are shorter and therefore have less impact on the company. But, in addition, internal processes have also been improved as different business models have been discovered“,
explains Sancho Lerena, CEO and founder of Pandora FMS.
The increasing use of new technologies by the population has increased the risk of theft. Not only on the street can one fall victim to thieves, but one can also lose sensitive information such as passwords or banking keys in the cloud.
In this case it is even easier not to realize that virtual robbers are committing a crime.
In addition, security no longer depends on you, but the security of third parties, those we shared our data with, becomes important.
What you don’t know about the security of your platforms
How can you maximize individual security on the network?
Easy-peasy.
Periodically modifying passwords and following some basic tips.
The first thing is to know whether the user has been affected by any breach in any platform. The process could be complex for someone who is not really used to all of this, but there are free and secure portals where you may just enter some identifying data of your account to find out whether the passwords are in danger.
Haveibeenpwned.com is one of the examples.
*As if it were a Google search engine, users only have to enter their email or phone number to find out whether the passwords of that profile have been leaked.
In case that leak is confirmed (a message appears in just one second and in a very intuitive red color), the procedure is simple:
Go to all those accounts and change the password.
As experts indicate, you have to set different passwords depending on the platform.
“It makes no sense to set the same password on all applications and systems.
That equals making things easier for thieves, because by taking profit from a single security breach they can take control of all your accounts for not having different passwords”, explains Sancho Lerena, CEO of the monitoring company Pandora FMS.
The fact of setting different passwords is usually a problem for the user, who risks either forgetting some of them if they do not keep them safe or losing some speed in the accessibility processes to the different applications.
Despite this, it is essential to reinforce the security barrier.
And that is because not only large entities should be protected.
One of the easiest things to verify is the strength of the passwords used, and implementing a system that monitors this may seem simple and innocent, but it is the first step to a safer system.
Security monitoring
Security monitoring is used to control key security aspects, such as backup verification, or the execution of anti-virus security programs.
The most powerful organizations on the market are a clear example of the importance of cloud security and data protection.
Until recently there was a specific department to manage all IT information and its protection, but the increase of that data bag and the increase of the danger in the cloud have turned monitoring into the most effective solution.
Monitoring the IT structure of a company means centralizing the control of all the information and, in addition, it allows to alert and anticipate each error.
“Our monitoring solution, for example, strengthens security where it is installed.
Businesses are placing increasing emphasis on the security of their IT information, and monitoring is critical to that end.
Any failure or error is reported instantly, so action is faster and losses smaller.
However, ordinary users should not forget that their information is also valuable for cyber criminals”, underlines the expert at Pandora FMS, aware of the interest of large organizations in protecting their data with systems such as monitoring.
Conclusion
Cybercrime has increased over time.
Users, given the number of processes that must be developed online, share more and more information.
A scenario that has made companies take their chances on monitoring systems such as that of Pandora FMS and that extends to individuals the need to protect their data on the network.
Let’s check out together the features and improvements included in the new Pandora FMS release: Pandora FMS 764.
What’s new in the latest Pandora FMS release, Pandora FMS 764
NEW FEATURES AND IMPROVEMENTS
New graphical interface of the sound events console
The sound events console has been modified to separate event configuration from their display. It now shows a progress bar over time until the next refresh and has improved usability in controls, filtering and selection.
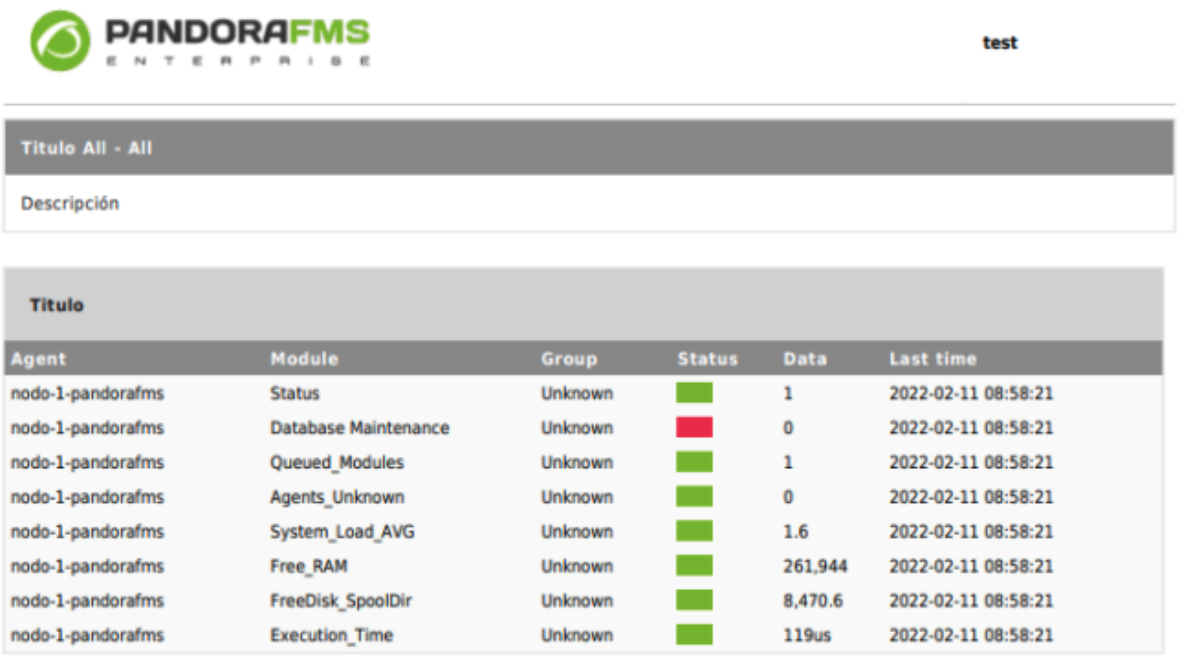
New data representation in agent view
Improved display of statuses and data in the main view of an agent:
Scheduled agent autoconfiguration application
Added the ability to schedule the appliance of Command Center agent auto-configuration rules automatically.
New dashboard widget: “Color Tabs”
A new widget has been added to Dashboards. With the “Color Tabs” widget you may choose up to a maximum of 10 modules that will be represented horizontally showing its name, data and status.
New dashboard widget: “Block Histogram”
A new widget has been added to Dashboards. With the “Block Histogram” widget you may choose as many modules as you want to represent their histogram in the same table.
Pandora WMIC package for ARM systems
Available as an RPM package and DEB in our community download section , in the “Other utilities and dependencies” section.
IPAM from Satellite
From this version it is possible to define IPAM network scanning from the Satellite server, indicating it in the Satellite’s server configuration file.
Satellite Server Visual Interface (GUI)
The possibility of configuring the Satellite server remotely from the server view has been incorporated. A dynamic search has also been added within the different tokens to speed up the configuration process.
New report server
A new report server has been incorporated, which works as a reporting-only console. It allows you to create very large and numerous reports in the background and store them on disk or send them by mail.
Cisco IP SLA plugin support with snmpv3 and snmpv2c – Open Plugin
Added support for snmpv2c and snmpv3 to the plugin.Go to Library
Plugin open Cisco ironports – Plugin Open
New plugin to monitor Cisco Ironport Antispam.Go to Library
SAP HANA Database Enterprise Plugin – Enterprise Plugin
Plugin to monitor SAP HANA Database using custom queries that can be defined in a file. The plugin comes with a file with default queries but can be edited for a custom execution suitable for each case. Go to Library
The Spanish tourism sector is preparing for a record summer in which they hope to emulate the summer periods prior to the coronavirus pandemic.
The government has already advanced that 90% of the foreign tourism that visited the country in 2019 will be recovered.
That year, 84 million foreigners were received, a figure that is expected to be reached this year, taking advantage of the high temperatures and the national tourist offer.
For this reason, the administrations of the main tourist centers are being reinforced with the necessary technology to control capacity in order to improve the performance of public services and minimize the environmental impact.
Pandora FMS helps to monitor and manage our beaches
More and more municipalities are opting for the installation of monitoring systems that collect all the data in real time and allow them to be managed from a main console.
Monitoring, present in most companies to improve the management of their IT infrastructure, captures all the data that is constantly generated and manages it from this central system.
In this way, access to all the information collected is much simpler and immediate and the capacity to react to any anomaly detected is improved.
The importance of monitoring in companies has spurred the administration’s interest in improving the efficiency of their services and they are now applying this technology in the management of their beaches.
Municipalities in busy tourist areas are particularly interested in knowing the state of the busiest spots and are focusing on beaches, where systems are already being implemented to monitor the state of each sandy area and control the capacity.
Thus, in addition to measuring how many tourists visit a place in a given time slot, it is possible to minimize the environmental impact on the territory by establishing precise measures to improve the environmental protection of the beaches as well as the fauna and flora that inhabit them.
“Monitoring is a reality that is present in the private sector, and increasingly established in the public sector, which improves the control of tourist spots with large crowds of people.
With these systems it is possible to calculate how many people are on each beach at any given time.
In this way, the efficiency of health and safety services can be improved or the capacity of some of these areas can simply be restricted if the environmental damage being caused is alarming,
explains Sancho Lerena, CEO of the Spanish company Pandora FMS, which monitors systems of giants such as Rakuten or Toshiba, as well as public administrations such as Madrid Digital or hospitals.
Where can we find these monitoring systems?
These monitoring systems are being installed in various parts of the country.
For example, the Coastal Observation and Forecasting System of the Balearic Islands will be installed on the beaches of Mallorca.
With this mechanism, the administration will allow tourists to share photographs taken from the same point on the beach, allowing them to see the evolution of the landscape in order to control its pollution and to record the hourly capacity of the beach.
This same experiment based on monitoring will also be present in Galicia, specifically in Vigo, or on beaches in Valencia.
The two main objectives in all cases are to control the environmental impact and to know the approximate capacity of each beach in different time slots in order to manage public services in the most efficient way.
Gran Canaria has also invested 500,000 euros in a system to monitor very busy beaches such as Las Canteras, Alcaravanera and La Baja.
For its part, Barcelona will use drones, after investing almost 170,000 euros, to measure the capacity of each beach without the need to identify the population.
In both situations, monitoring will be essential to collect all the data and enable the authorities to act as appropriate.
“Monitoring processes are in our day-to-day life, it is normal for administrations and tourism companies to adhere to this type of systems,” acknowledges the CEO of Pandora FMS.
“Monitoring allows access to information by a single means .
In this case, a computer where all the data generated every second is concentrated and which, if the monitoring system did not exist, would have to be collected from each specific console.
Thus, if there is an alert in an area, action can be taken from the central console and the other areas can be alerted,” says Lerena.
Tourist wave
The summer of 2022 was set to be the summer of the return to full normality, also in the economic sphere.
However, the outbreak of the Russian invasion of Ukraine and the subsequent inflationary wave led to fears of a new crisis from May to the present.
Despite this, the Government has reaffirmed that the Spanish economy is “strong” and has positioned tourism as one of the driving forces in the coming months.
The forecasts of the Executive go through to recover nine out of ten foreign tourists who visited Spain in 2019, a year in which 84 million people were received in the 12 months of the fiscal year.
At the moment, more than 20 million airline seats are already estimated to be booked for these months.
In addition, domestic tourism is also likely to grow by 3%, so the economy will not only be driven by the foreign population.
There is quite a wide range of solutions offered bymonitoring as a service to any company, from performing any analysis to detect the root cause of the issue to determining the path of the failure.
Here goes…
Our opinion on monitoring as a service
One of the most important and obvious benefits it brings to the table is that it solves training problems of workers involved or just solves the shortage of talent of these workers right away.
It may sound a bit harsh… but it is what it is.
The increase in the amount of information available in companies, and the obligation to be able to manage this IT structure well means that workers must constantly be better qualified.
In addition, the increasing importance of IT means that infrastructure managers have a certain amount of work overload.
Something that with a monitoring system does not happen!
Rather the other way around, monitoring as a service establishes a theoretical bridge between technology and business, drawing a scheme where you can easily detect where the source of the problem is, saving time and actions to the operating team.
Monitoring reduces the importance of the traditional involvement of people from different areas of the organization and the work overload that managers in this process may have.
To sum up, monitoring systems control all data and allow access to information from the same platform, avoiding that those in charge of this area have to stay aware of several fronts without fully concentrating on a single one.
Also inactivity cost is reduced!
Let’s get to the point!
“You must take into account that the transformation of a given company implies that there is more software.
And, therefore, more business areas that depend on technology. A series of changes that imply the need to hire more competent profiles.
Everything with the aim for all pieces to fit perfectly, both the computer and its software as well as the network and the technician who handles it “.
Explains Sancho Lerena, CEO ofPandora FMS, as you surelyl know, an international reference in monitoring.
An example of this need is that the growth of hybrid infrastructures is 25% per year according to IDC data.
For that reason, many companies are taking their chances on taking out their IT monitoring infrastructure to save money and especially time.
This process of getting the entire IT organization under the umbrella of the same system also helps the infrastructure manager, as they have higher capacity to manage its records.
On the one hand, it collects all the data despite the fact that it is a large volume.
And, secondly, it concentrates access to all that information on a single centralized console.
In conclusion, we get over the lack of time for the worker to be aware of fundamental tasks such as security or data management.
It also gets rid of the possible lack of capacity to adapt to the different operating systems that may exist in the same company.
And, lastly, the workload involved in facing a constant data flow where any minimal error must be detected is minimized.
Systems such as Splunk, Datadog or Pandora FMS itself help in the process.
Conclusions
Through monitoring, it is possible to use information in a reactive way, anticipating problems and alerts received; preventive, since analyses are obtained that help to be prepared for any worst-case scenario; and retrospective, since the emerged crises are also studied to find out the extent of their impact and know how to take measures properly in the future.
Pandora FMS Open Source is not a freemium software, it is not bloatware nor shareware (*Wink for those born before the 80s). Pandora FMS is licensed under GPL 2.0 and the first line of code was written in 2004 by Sancho Lerena, the company’s current CEO.
At that time, free software was in full swing and MySQL was still an independent company, as was SUN Microsystems. Today there are thousands of users of the Open Source version that regularly download updates through the system that we designed for that specific purpose.
We do not know more about the subject (neither their names, nor their companies…) because, above all, we respect privacy.
We consider Pandora FMS to be a real free software. The project has been active in Sourceforge since 2004 and we have all the awards granted by this entity that leads Open Source. All the code is available on Github in real time, but we do believe that there is something more important and that is the documentation we have available in five languages (Spanish, English, French, Japanese and Russian), with a level of depth that allows you to get the most out of it without having to pay for certifications, training or consulting.
Printed, the manual has more than 1,000 pages (per language) and is maintained by our professional development team, Q&A, translators and professional documentalists. We also have a public forum where we solve questions, with more than 15,000 messages.
We believe that freedom consists in offering users options, not just giving them part of the pieces of a puzzle without instructions.
Pandora FMS Enterprise
However, Pandora FMS has a version based on a commercial license that extends some of the features present in Pandora FMS OpenSource version. This license incorporates additional source code that is not publicly available or free of charge.
These features are oriented to demanding professional environments that require some automation and more specific tools already created to use them in operation and with professional support so that if something fails they can ask and get a patch if necessary. It is exactly for these types of environments that we designed Pandora FMS Enterprise.
If you want to use Pandora FMS Community and have doubts about whether it will be enough for your organization: Don’t hesitate!, it is not a question of size, we have users of the Open version with thousands of agents and who have been using it for years.
Obviously the main benefit of the Enterprise version is that you will have someone to support you at all times. Whether it is some problem with an update or throughout the installation of a plugin. But there are many small differences that can be key to optimizing your day-to-day management.
Next we will describe some of the Enterprise features. If you want to try them yourself, you can test the waters of a 30-day trial version, but let us show it to you at an online meeting and you’ll save yourself the trouble of messing with the software. Your time is valuable and while our documentation is extensive, PFMS has plenty of features.
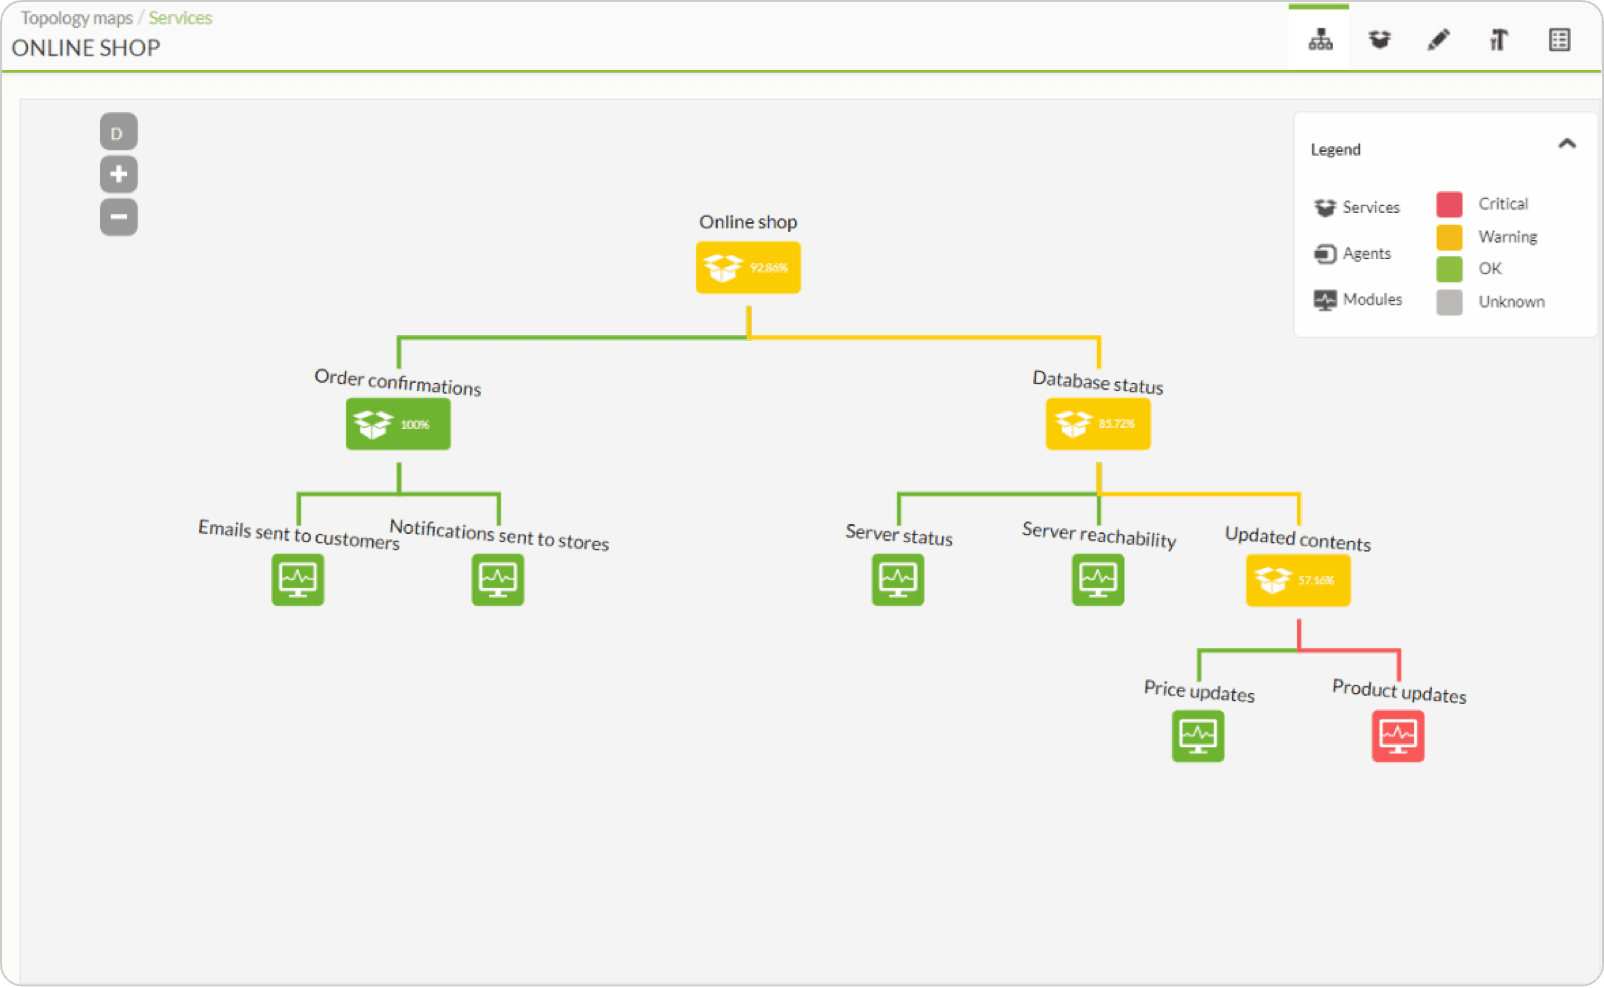
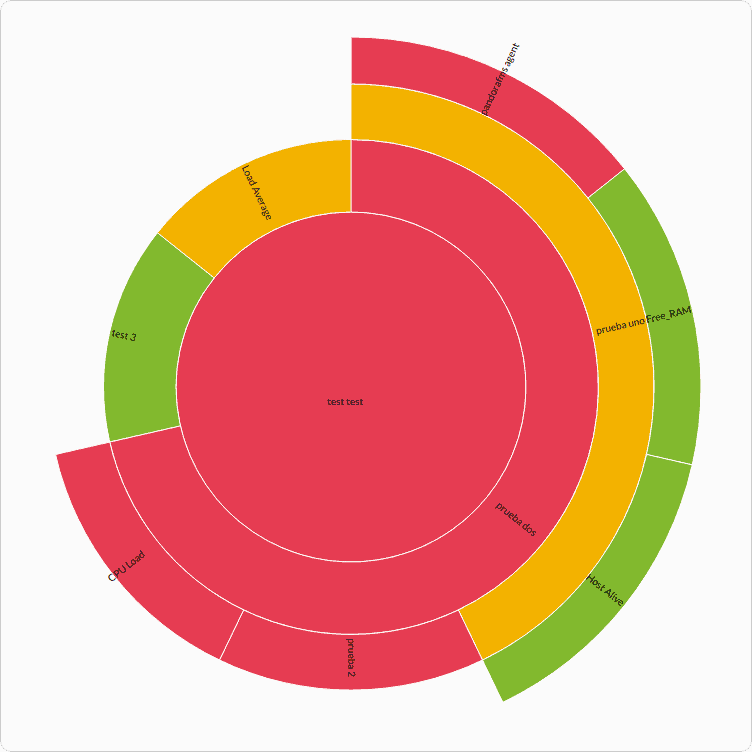
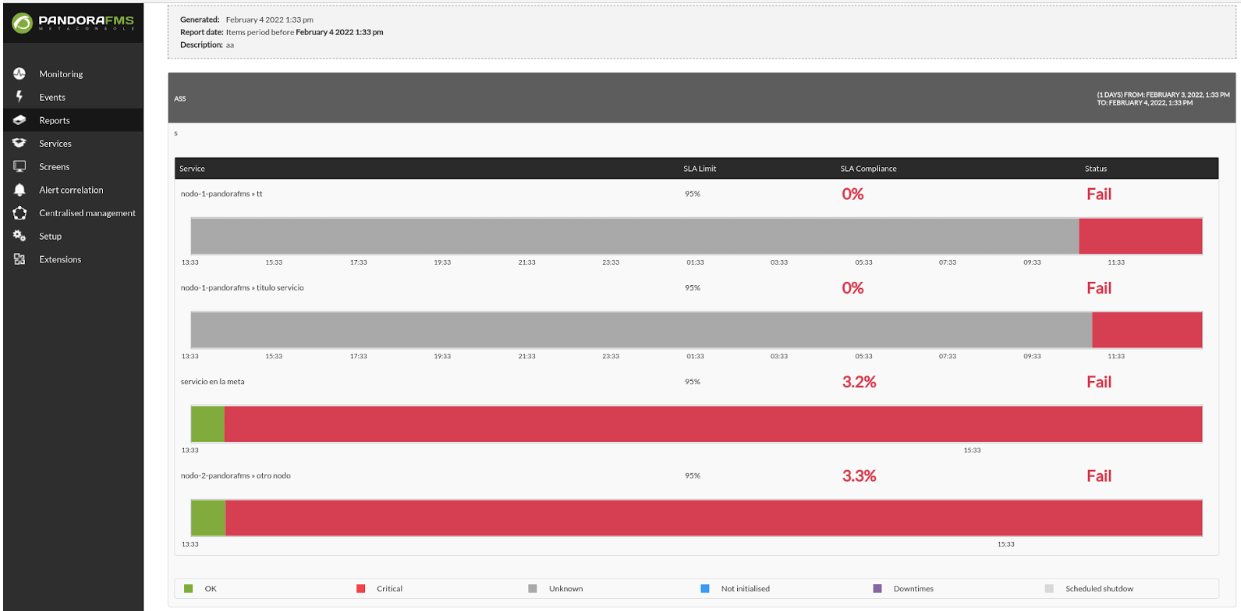
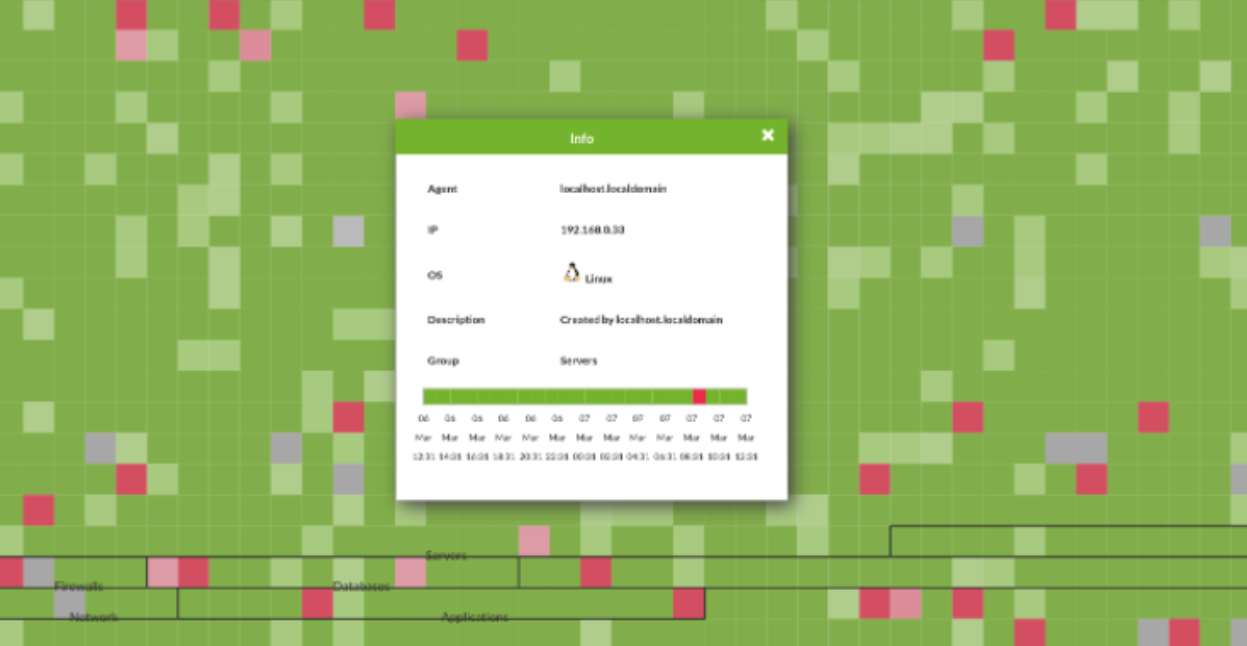
Services are the way to show in a simple and visual way what things are like in your organization, classified into different entities that in turn are made up of other services and / or metrics.
That way you may perform an automatic root cause analysis and find out when a service is affected, where the source is and even have it displayed in the form of a tree:
Services complement the existing display options in Pandora FMS and allow system managers to define weight rules that have their systems’ redundancy to alert only in case of need, not when something irrelevant fails.
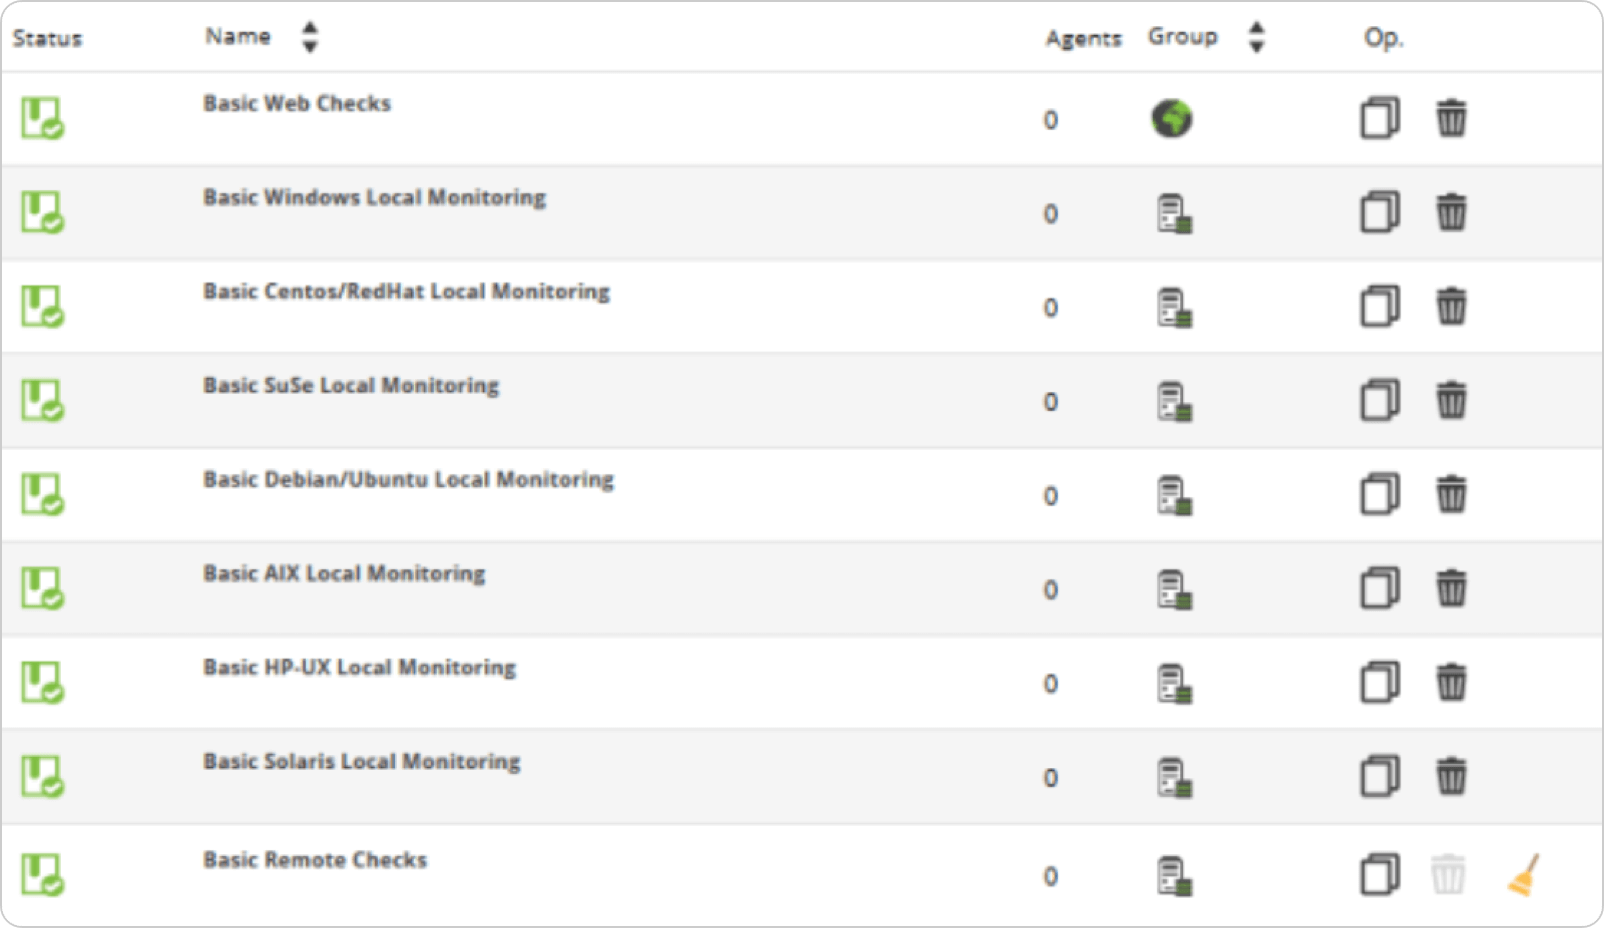
The need arose from a client who managed many computers with different purposes and technologies. They found out that monitoring Windows 2000 computers was different from monitoring Windows 2003, and that of course the Redhat Linux had different needs from the Debian Linux. It also had differentiated database environments, such as DB2 or MySQL.
Base monitoring could be “compartmentalized” into different sets of checks that could be standardized, so that any Linux machine that had Oracle could be monitored the same. That way, we made sets of checks that could be easily deployed to machine groups.
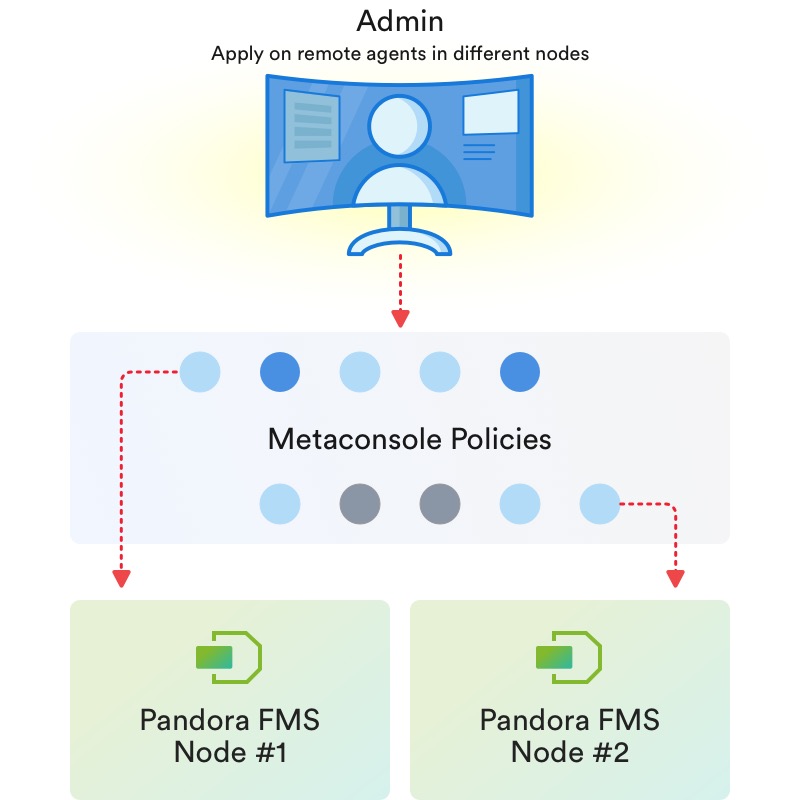
Thanks to policies, it is possible to homogenize monitoring and to deploy standard monitoring by technologies.
Thus a system can have different policies applied (e.g. base operating system, database, application X, network performance, etc.) and for every time you modify the policy, it can get “synchronized” with those systems that are subscribed to said policy, in a totally automatic way.
Of course, exceptions can always be made to policies at individual level, and each system can have unlimited policies in addition to custom monitoring. Using policy monitoring can save system administrators a huge amount of time.
If you need to sell your own monitoring product, with your own brand and full customization not only of its look, but also of its installers, command path, running services, ISO installation images, Windows agents, logos, manufacturer and product names, Pandora FMS Enterprise has different customizing levels.
The most basic, and included as standard in any Enterprise license, allows you to customize the appearance of the console so that it does not look like Pandora FMS but your own product, with your own brand.
If what you need is to go further, and generate a software with another name and that from the installation process to the name of the database everything is alien to Pandora FMS, then OEM customization is what you need. We can even generate update packages specific to your OEM (or teach you how to do it so you can fend for yourself).
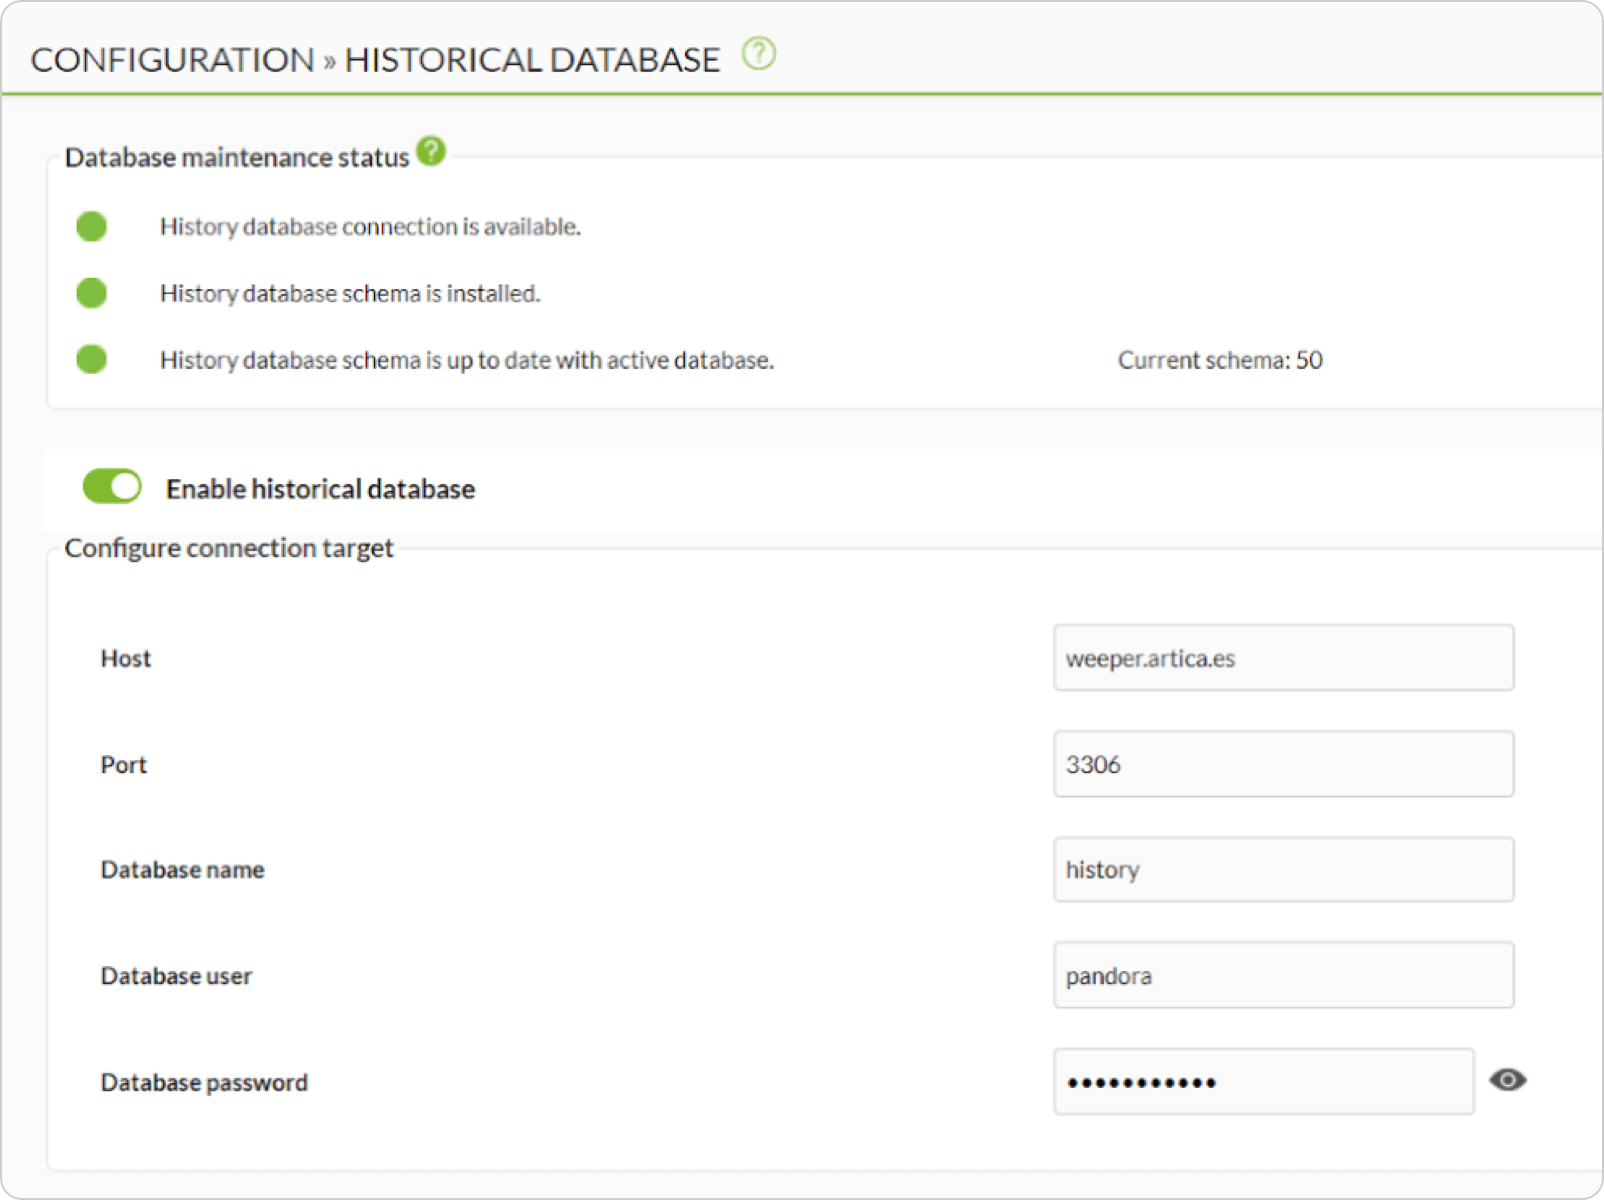
Pandora FMS Enterprise has a secondary storage system in an additional database. The system automatically transfers the data from more than N days to the history database and when it needs it to make reports or graphs, it uses both databases to gather information.
This allows you to have an almost unlimited data history (several years) without compromising the speed of access to day-to-day data.
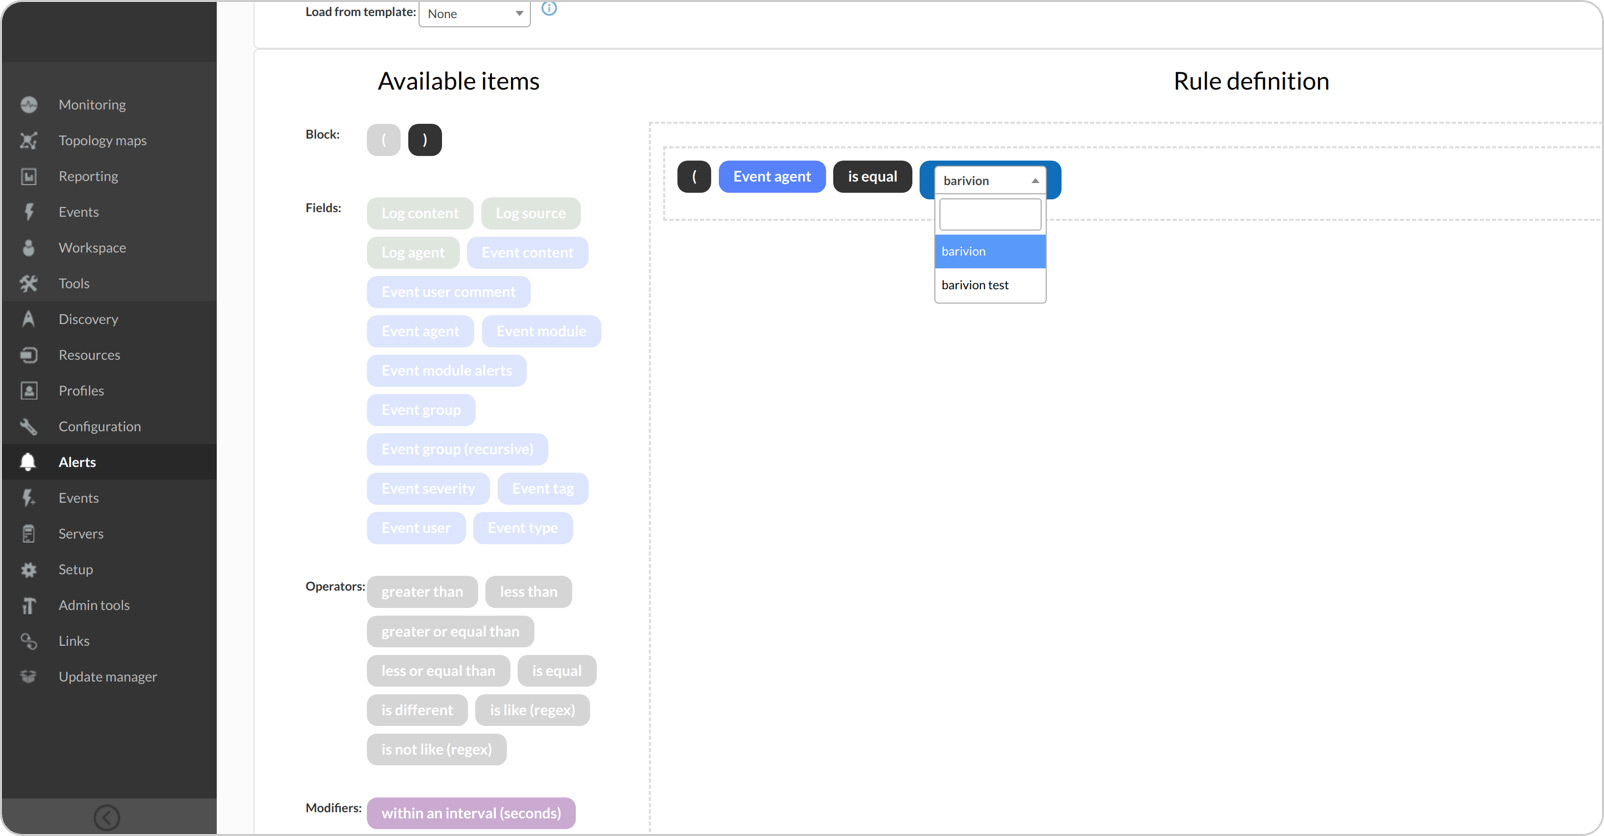
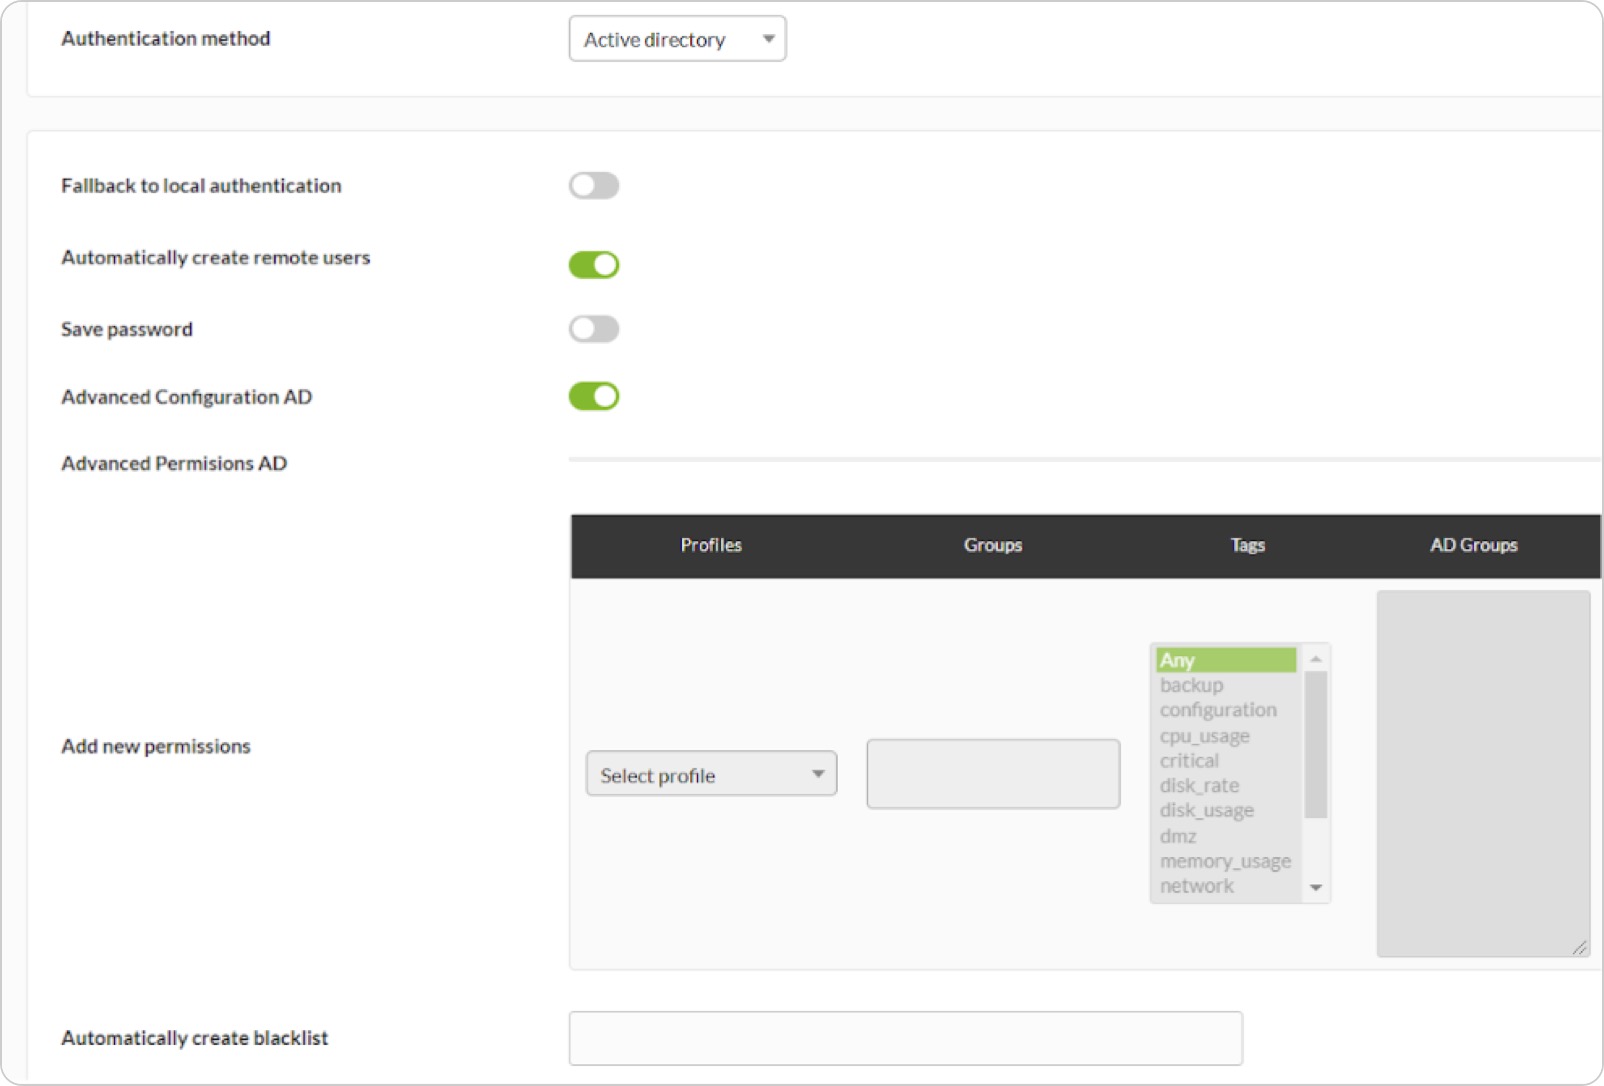
Whether you need your installation to rely on an Active Directory to authenticate users, or to automatically create them at login, assigning them specific profiles or filtering them through a blacklist, this feature is designed specifically for professional environments like yours.
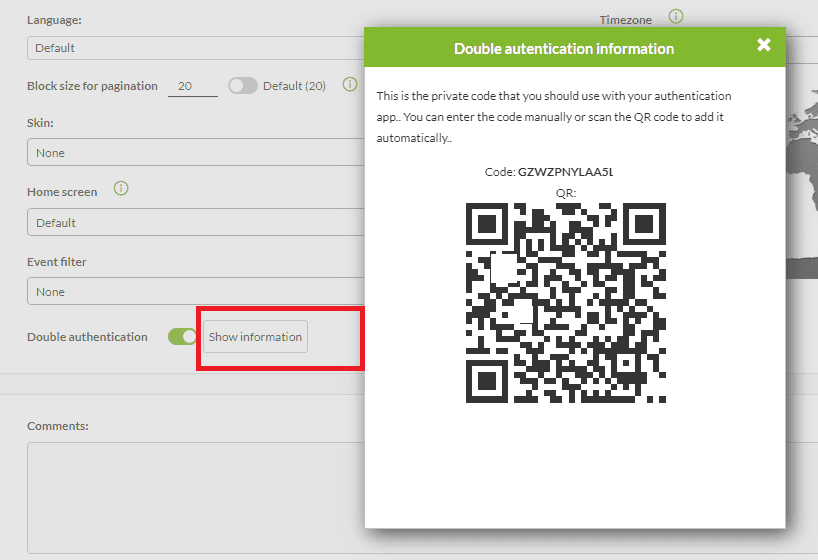
It has advanced options such as delegating to a secondary server, excluding administrators, complementing it with double authentication through Google Auth and many other options.
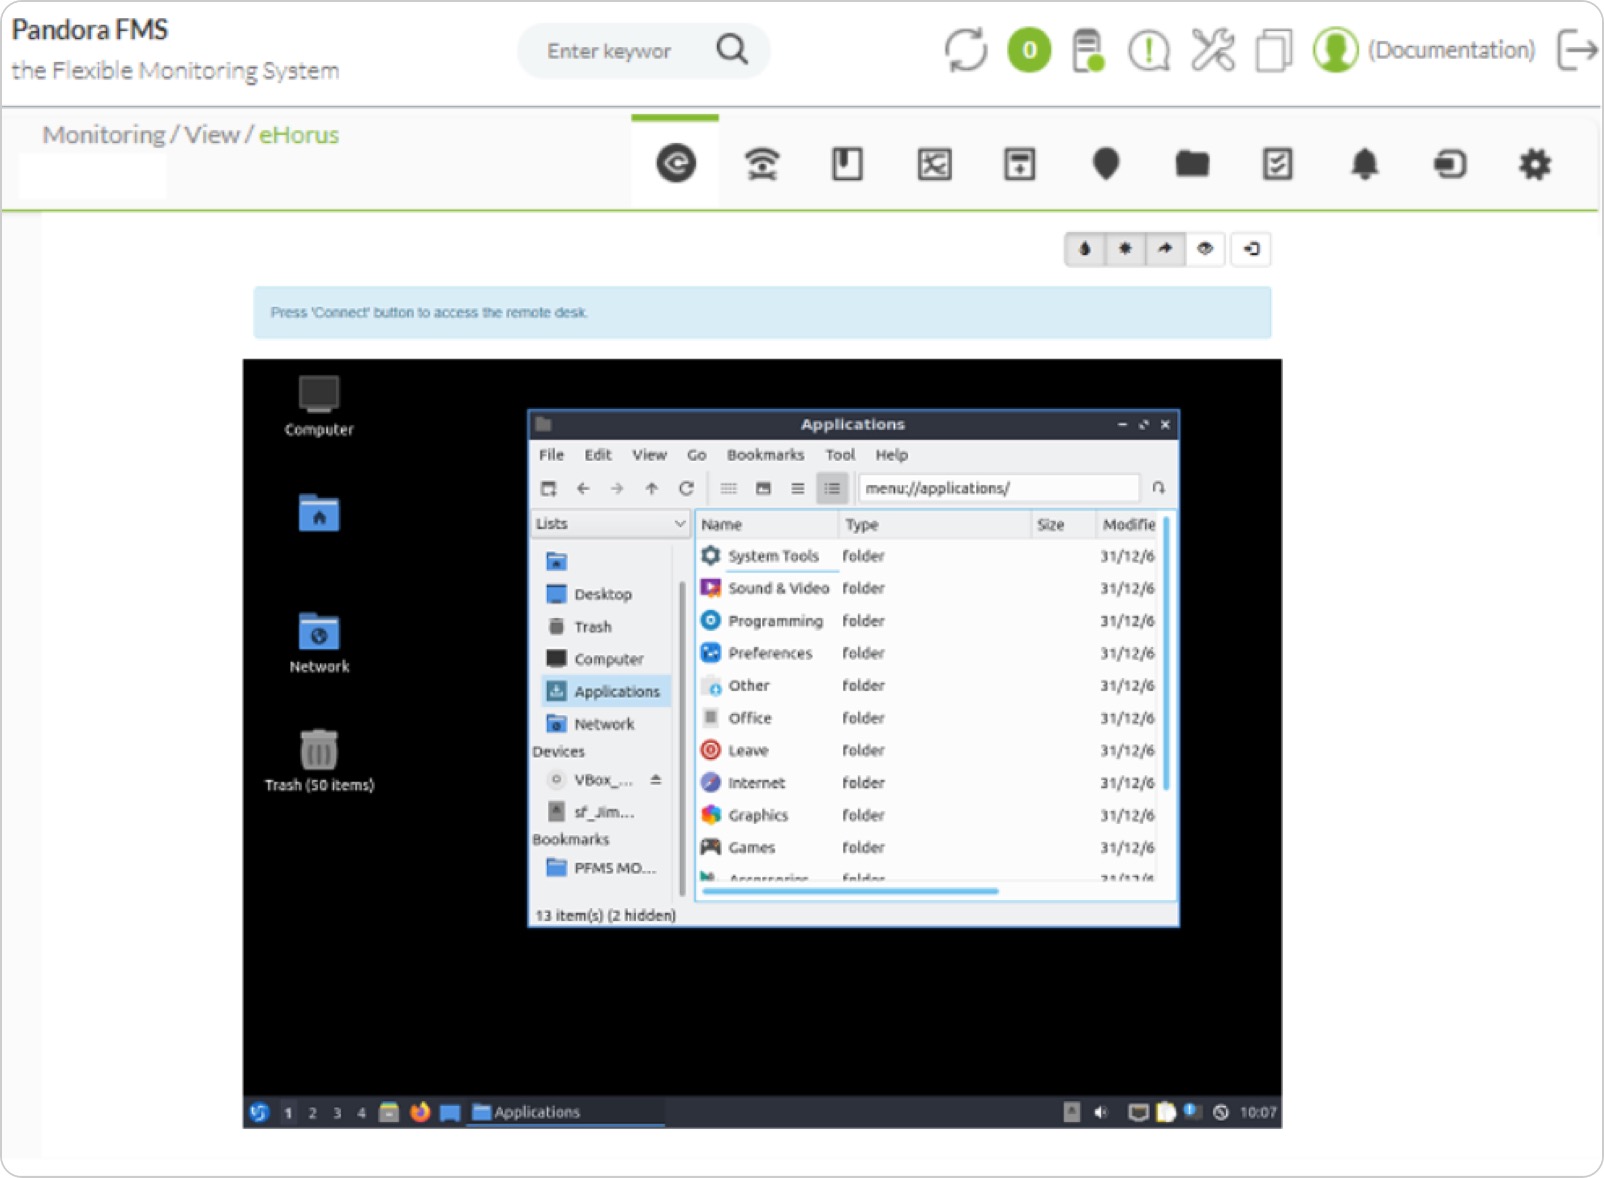
Remotely control and access your systems, whether windows workstations, Linux or Windows servers, or Raspberry or similar embedded systems. Access the remote shell as if you were in front of it, the remote desktop, or copy files both ways. All this from the same Pandora FMS WEB console, fully integrated into your asset management.
In the Enterprise version you may have your own on-premise infrastructure of eHorus servers so that all communication among your systems can be managed and controlled, with total autonomy from third parties and with maximum security and confidentiality.
In the community version, however, you may use our Cloud servers, up to a maximum of five devices for free.
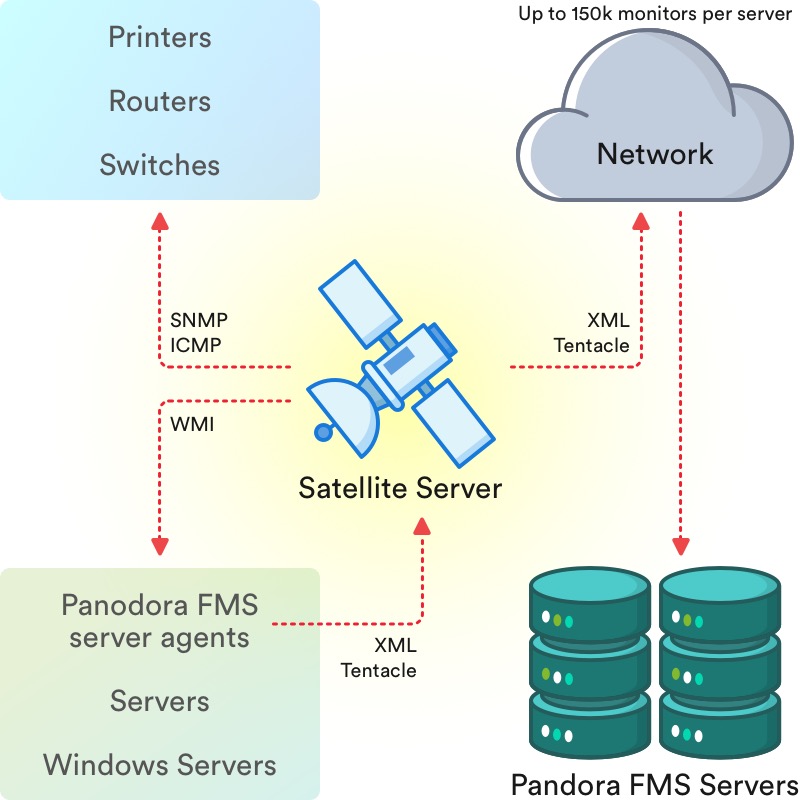
Satellite servers allow headless remote monitoring of entire networks of equipment in a distributed way. Install Satellite servers in the networks of your clients, they will obtain metrics of all kinds of devices around them, exploring what they have around them automatically and sending the information to the central server where you may manage it as if they were normal agents.
Satellite servers are perfect for making deployments in remote sites, customer offices or inaccessible environments. They can be installed on Raspberry, or any type of container.
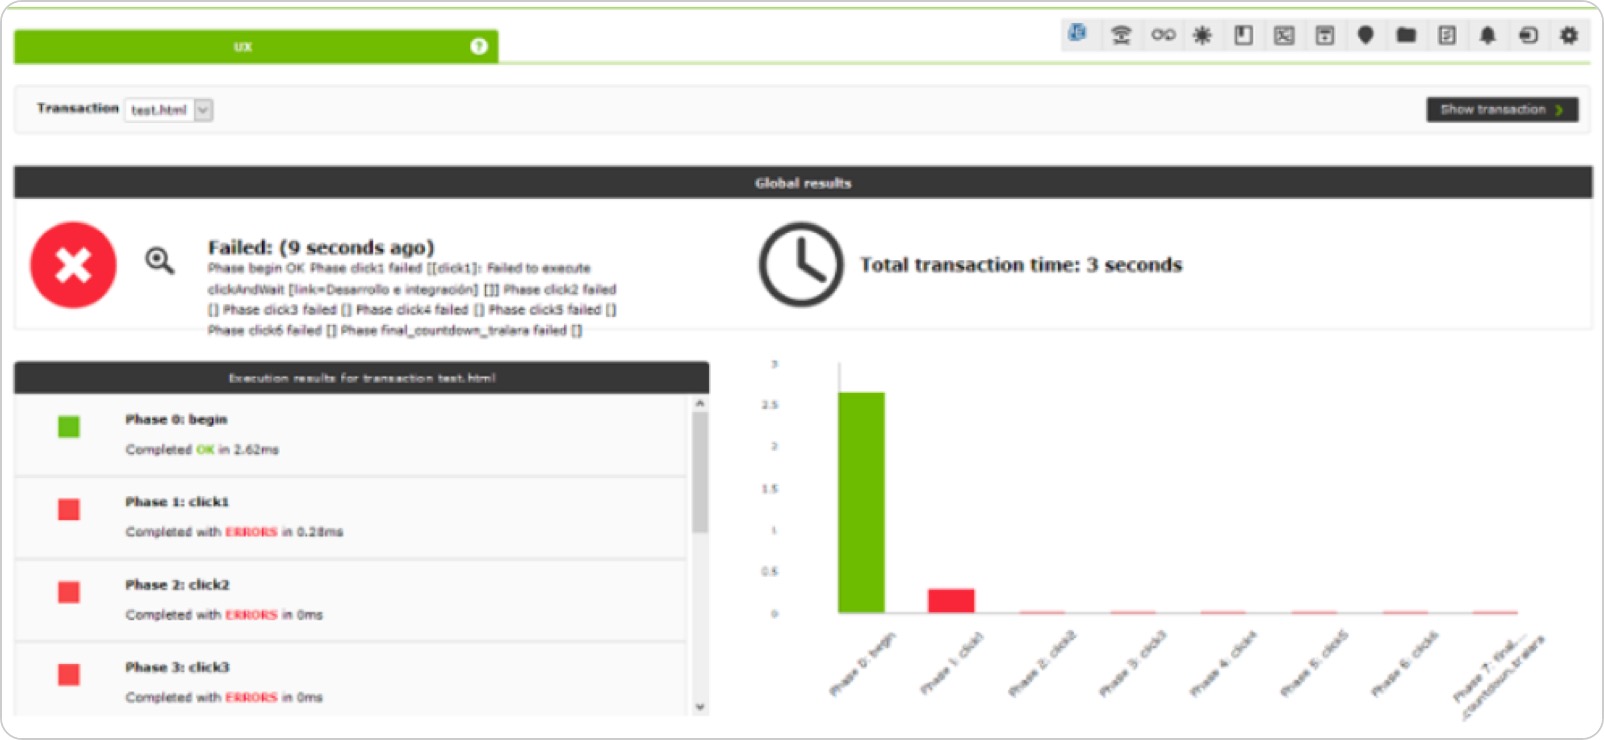
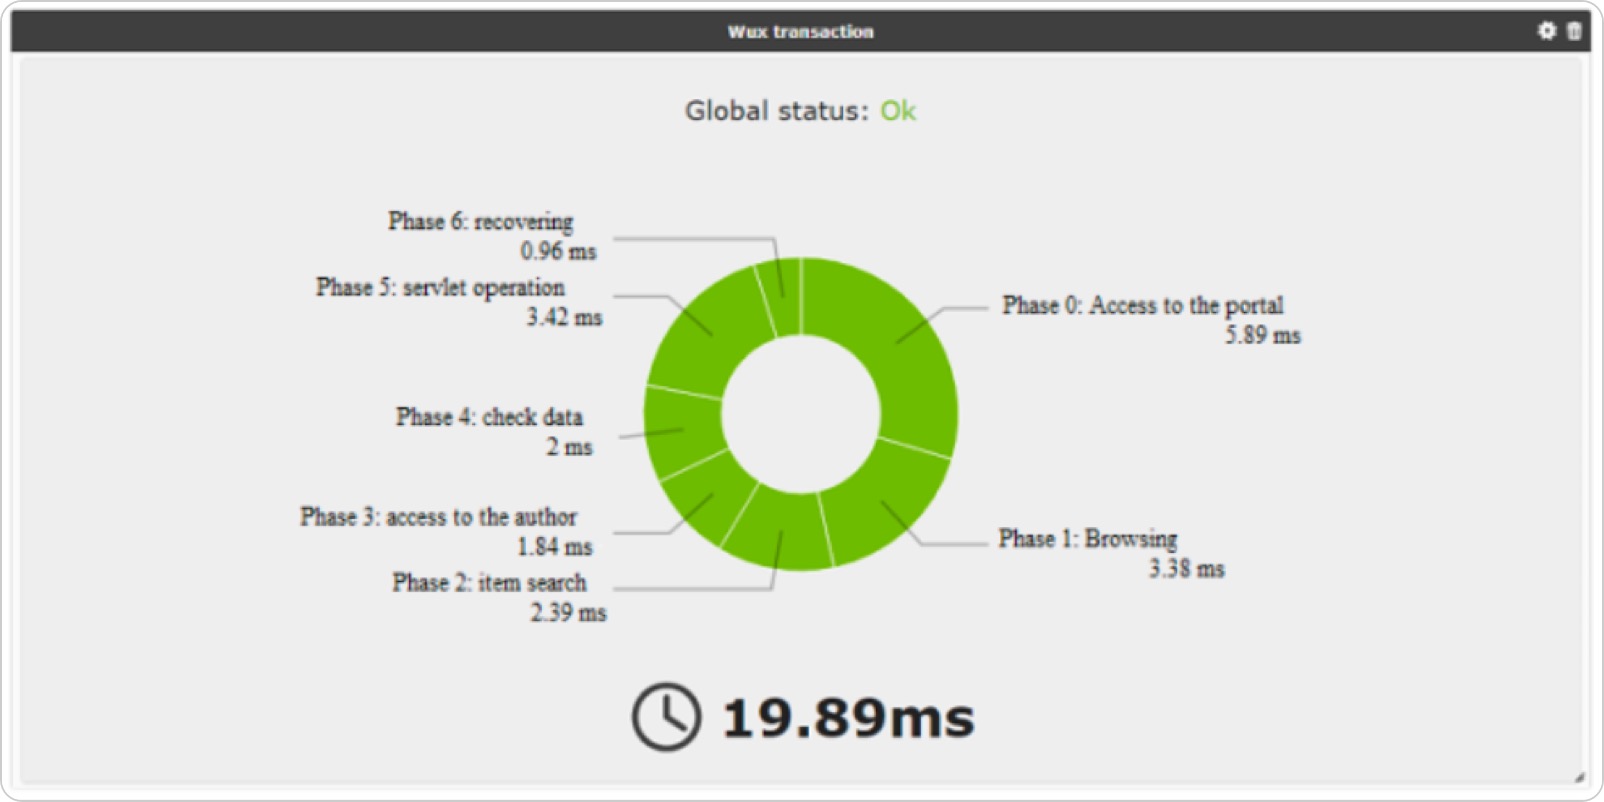
Nothing like observing things pretending to be a real user, if possible from the same chair as the real user. This is what user monitoring consists of, replicating a transaction from beginning to end, step by step, calculating the time it takes in each step, and verifying that each step is completed correctly.
That way you will not only find out whether it fails, but you will also know where, and how long each step takes. You may even take a screenshot to know what the fault looked like. This can be done for web applications (even if they have Java, Flash, HTML5, etc.), and also for traditional desktop applications. It can be done centrally (WUX) or in a distributed way so that the probes perform the tests from different geographical locations.
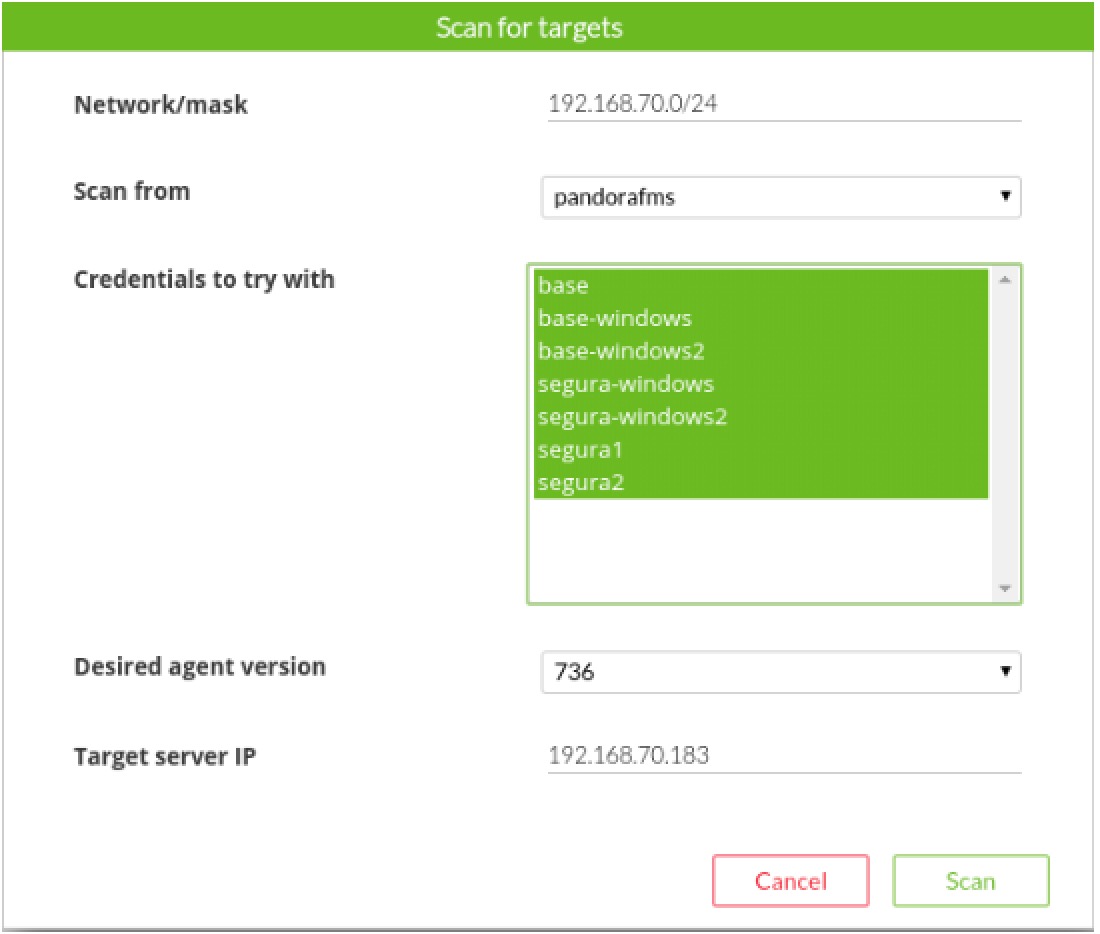
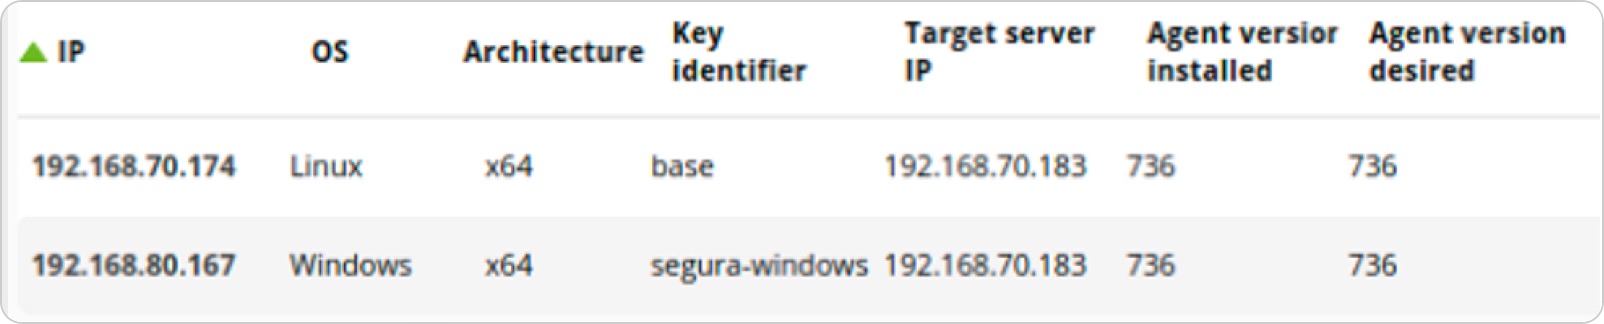
We know that deploying agents and configuring them is one of the most burdensome points of deploying monitoring. That is why we created a tool that allows, providing credentials, to connect to Windows or Linux systems to copy the agent and carry out its unattended installation.
It allows you to customize the installation, by different networks, environments or groups of machines. From dozens to thousands of systems can be installed or upgraded from the agent deployment console.
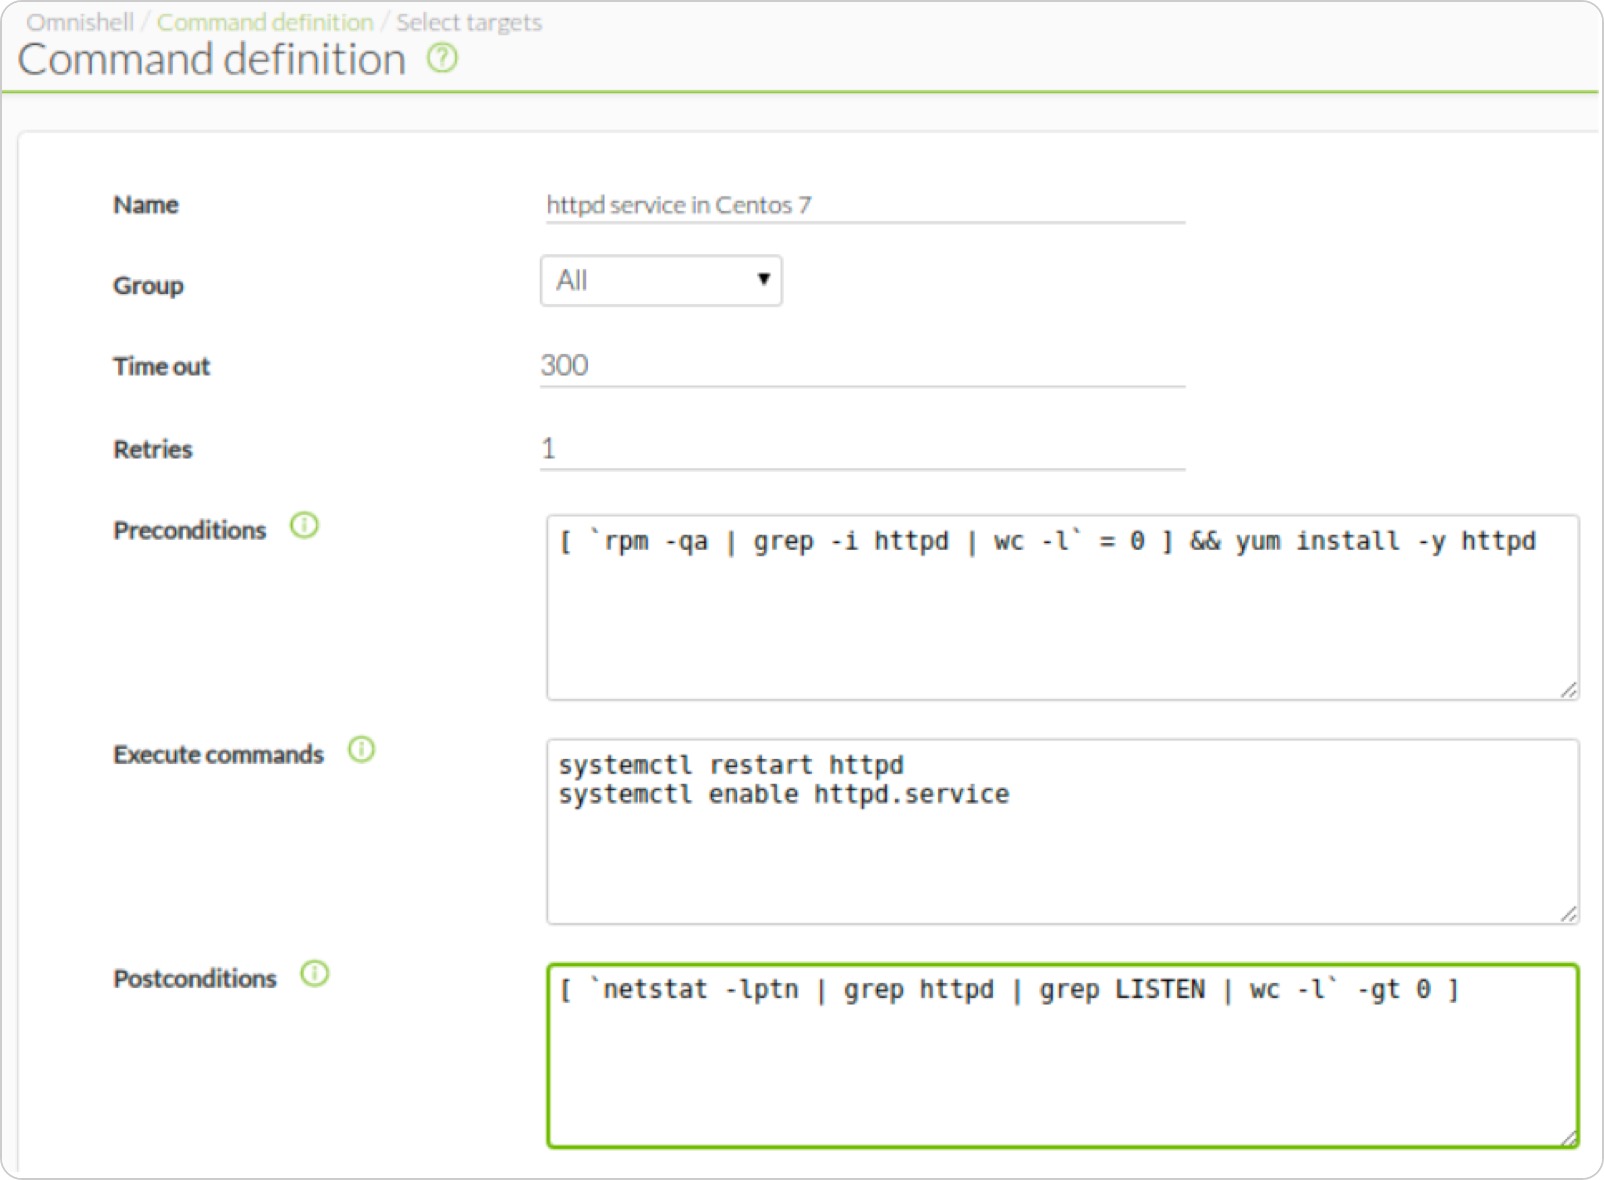
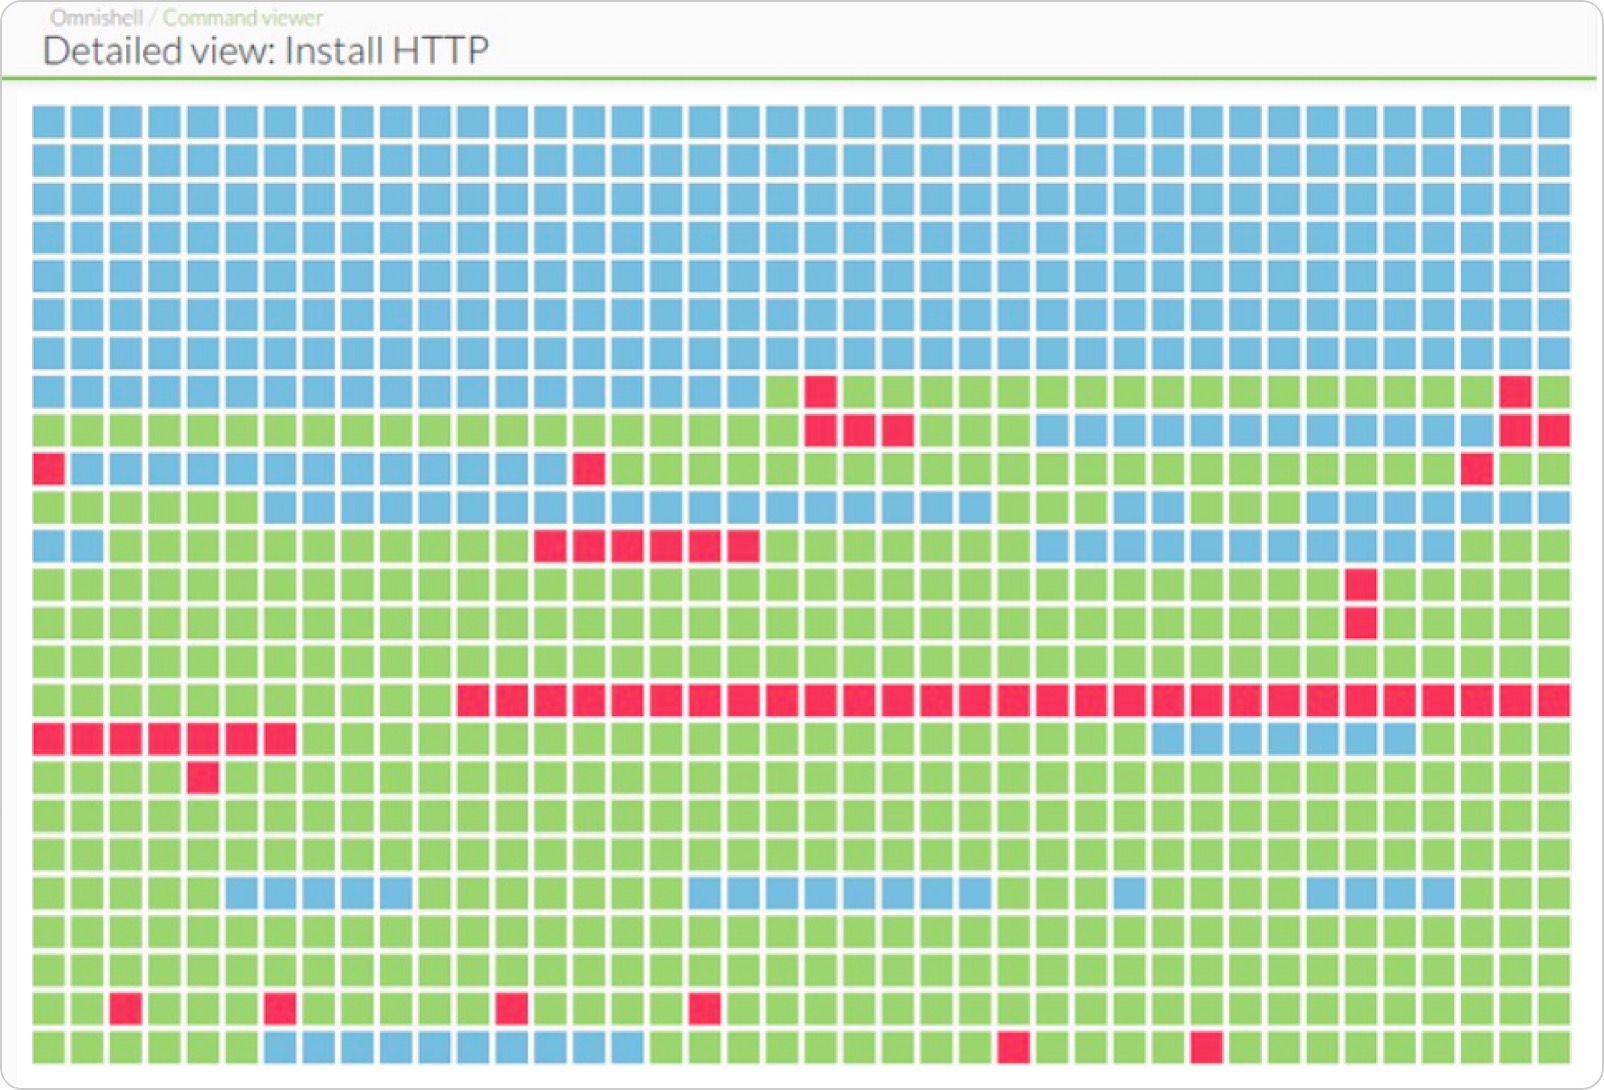
Omnishell is a Pandora FMS Enterprise feature that is used for orchestration (IT automation). It is a fully native tool integrated into the console that uses PFMS agents to execute command blocks on selected targets.
A use example would be to configure the auto-start of the HTTPD service on CentOS 7 systems massively. Another example could be to install a manual patch on those Windows machines that you select from a list. It can be one or several hundred machines.
The system is designed to be executed on hundreds of systems simultaneously and wait for the order to be executed, showing on the screen the progress, machine by machine:
The total monitoring solution for full observability
Contact our sales team, ask for a quote or solve all of your doubts about our licenses.
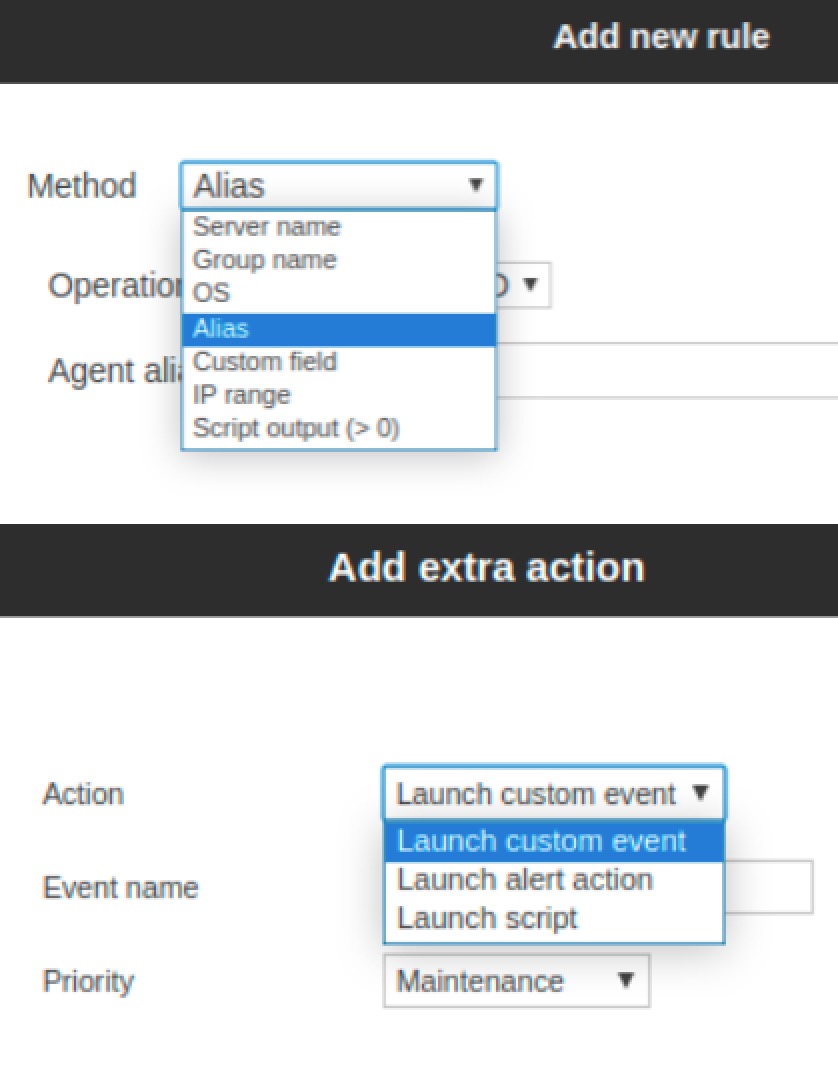
Auto Provisioning and automatic agent configuration
It implements an automatic mechanism by which it can apply policies and changes to newly provisioned agents, so that after deployment, monitoring configuration is automated, assigning it group(s), monitoring policies, alerts, etc.
This customization is done based on rules. For example, having a certain IP range, a specific brand or custom field, or a hostname with a certain pattern. In addition, after you make the configuration change, you may generate a custom action.
Deploying advanced monitoring requires bringing scripts and small applications (ours, yours or from third parties) to the monitored systems, to be executed by the agent in the form of plugins.
Collections allow you to gather this set of files and send them them to agents in an integrated way in the policies. That way, using plugins is something simple and transparent for the final operation.
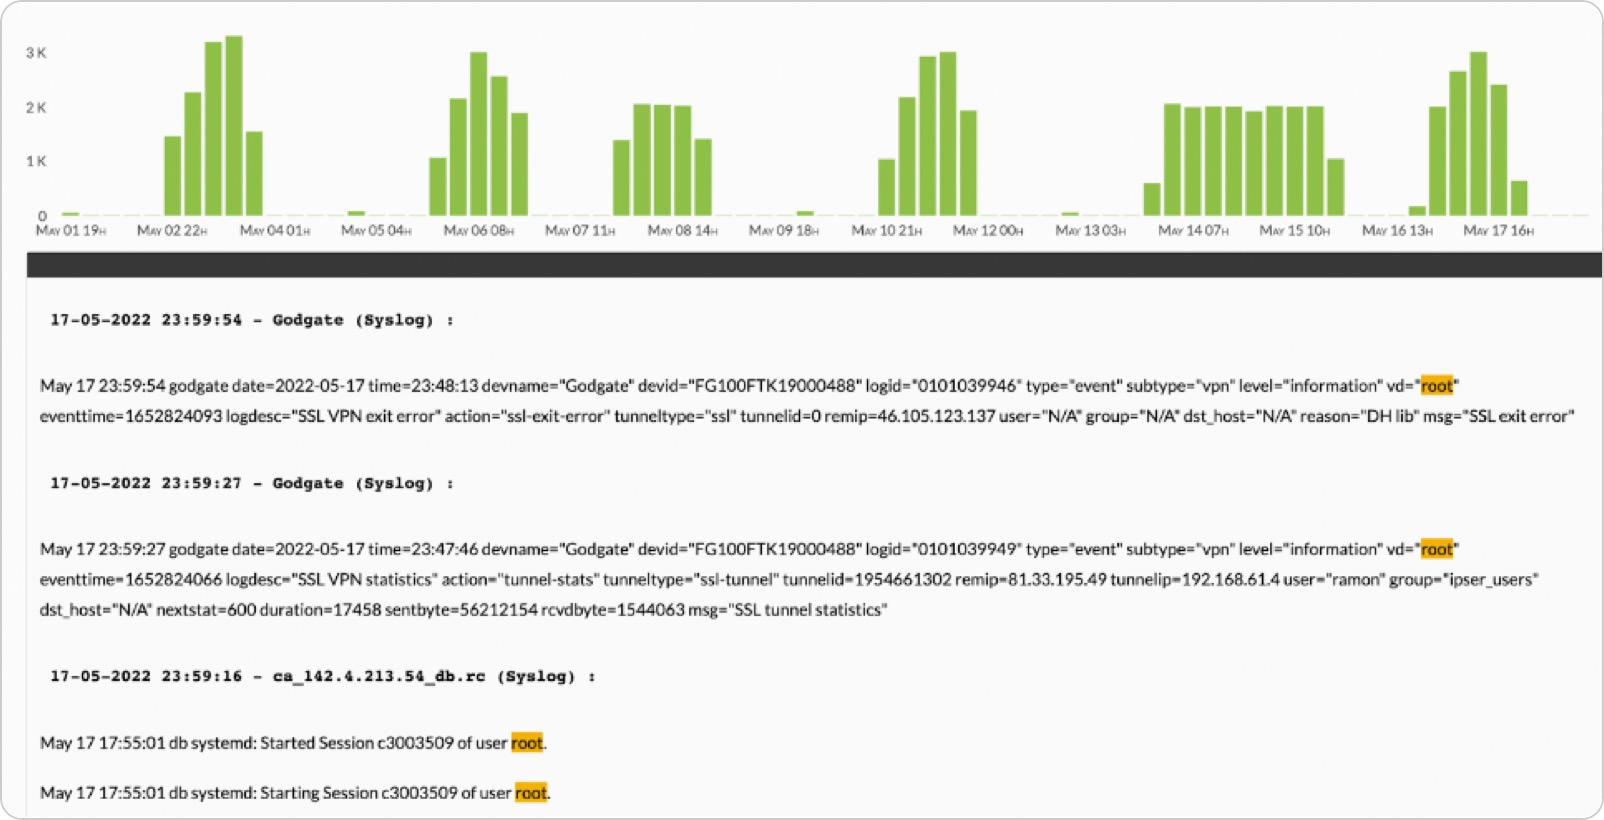
Pandora FMS can collect logs from any source that supports syslog or through software agents (Windows and Linux). Such logs can be plain text files, or Windows system events.
They will be collected by Pandora FMS monitoring agent and sent to the server along with the monitoring data. So if you already have agents installed, you may collect logs from those systems conveniently and quickly, and without additional software or licenses.
Unlike monitoring data that is stored in a conventional SQL database, logs are stored in a separate Elastic system. You will be able to store gigabytes worth of logs and keep them for a long time (you will only need more disk space). You may set up alerts or search through your data sources. It is the ideal complement to comprehensive monitoring, and fully integrated into the console.
PFMS inventory allows you to obtain data of many types: installed software packages, users with access to the equipment, installed patches, hardware devices, firmware and version of the base system, license or serial number, etc.
Alerts allow you to generate actions in case of finding or not finding certain data on a computer with inventory information (whitelist / blacklist).
For example, what if you know that there is a vulnerable version in your systems? Well, you could create an alert that notifies you if someone is using it. Or on the contrary, if you need an application installed on all your systems and someone does not install it, you may find out in real time.
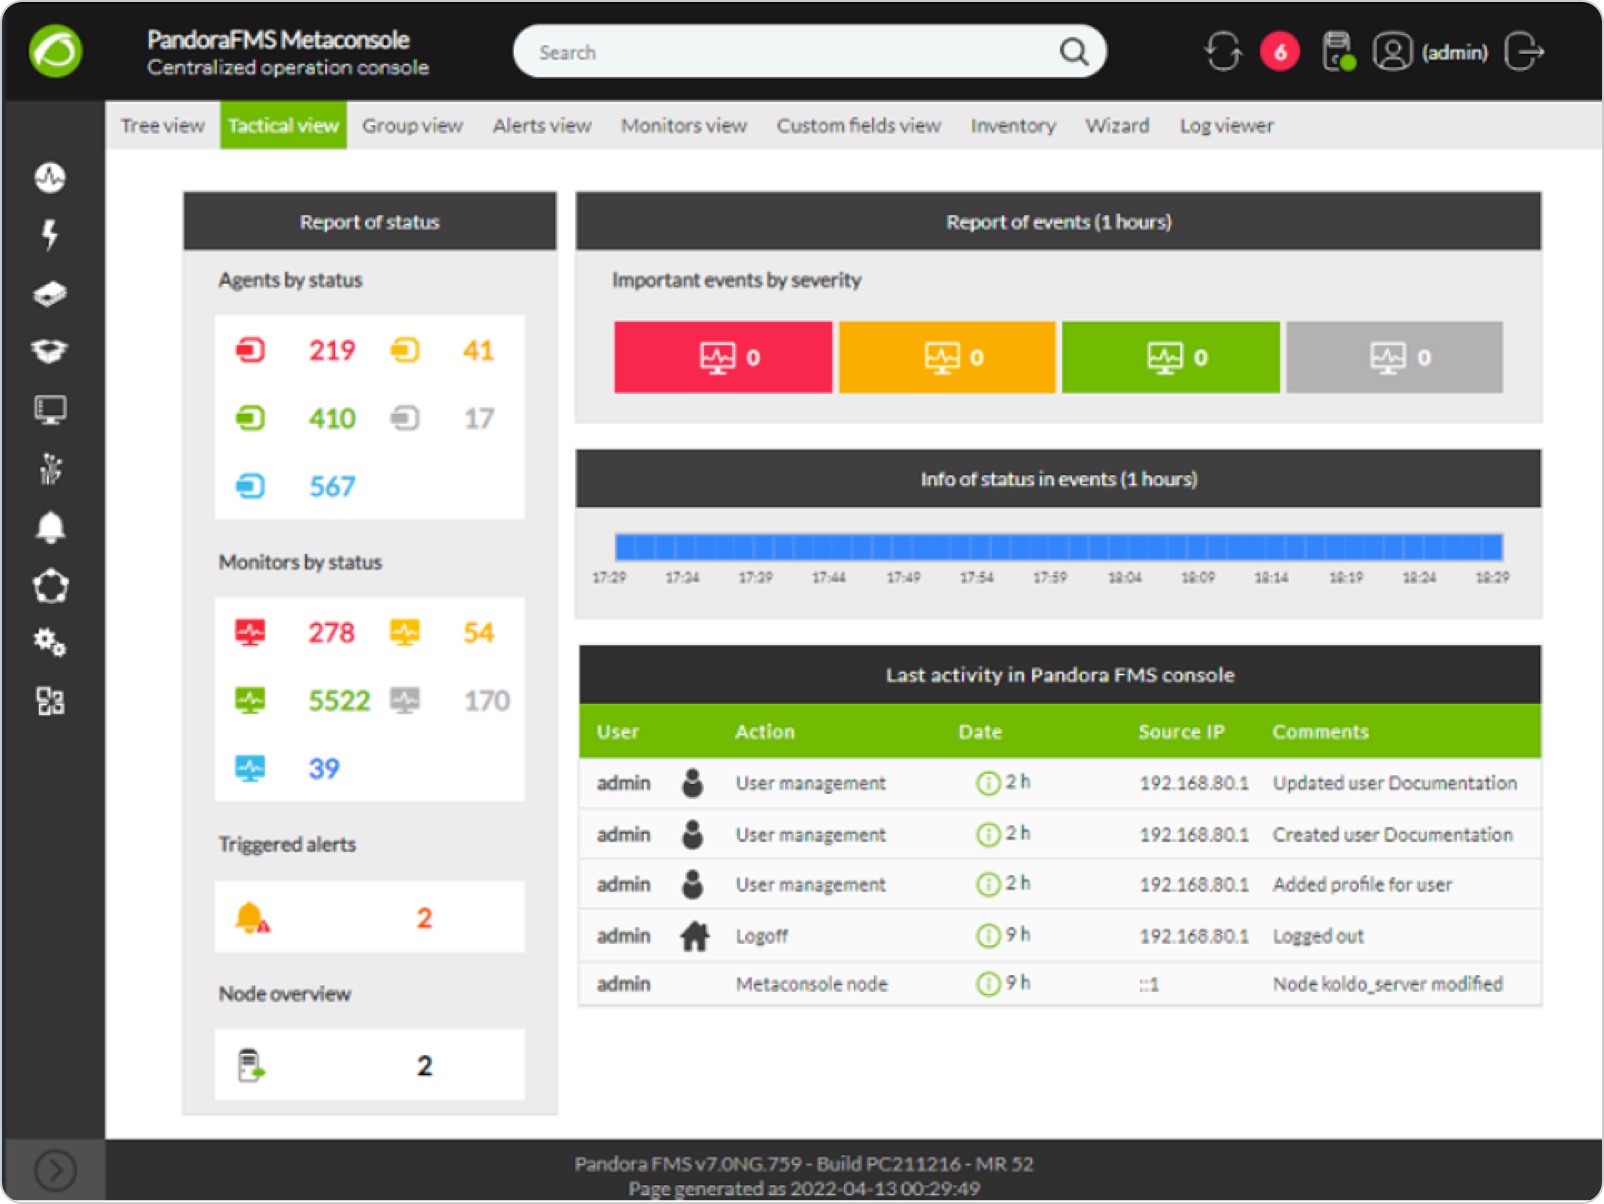
The Command Center is the jewel in the crown of Pandora FMS.
It serves the purpose of centrally controlling an unlimited number of independent Pandora FMS instances (each with its server, its console and its databases) so that you may manage dozens of thousands of agents from a single point, while these systems are in turn managed by independent instances.
This federated management system ensures uniformity and ease of management. It is a robust system where one system failing does not affect the rest of the systems, and where growth is fully horizontal and distributes loads automatically.
We have clients with more than 40,000 agents and more than one million metrics collected.
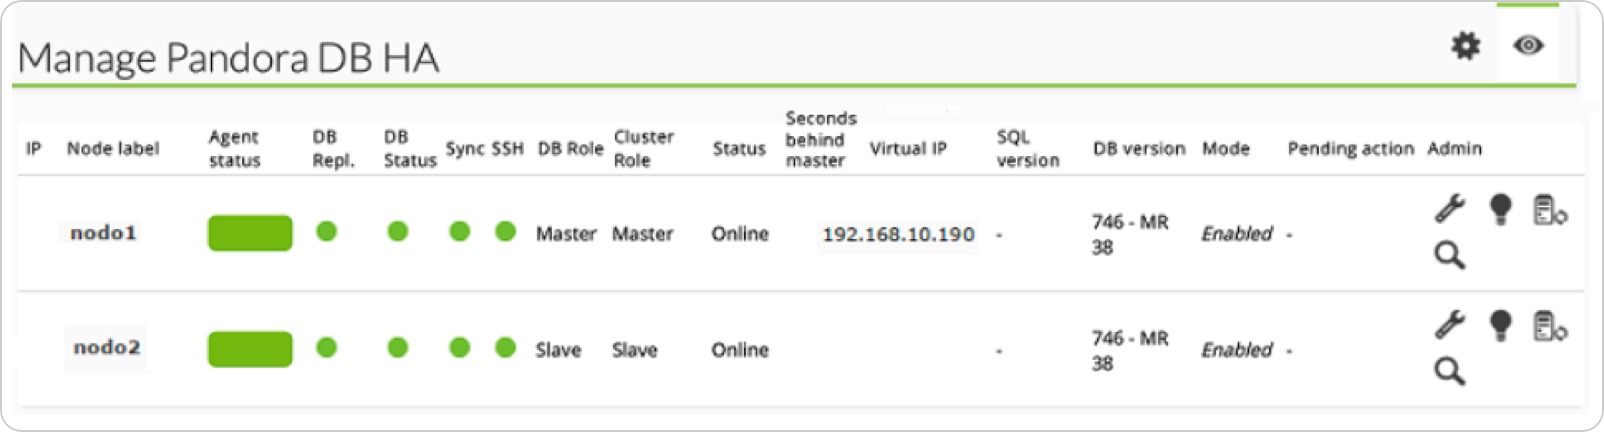
In critical environments and/or with lots of load, it is possible that it is necessary to distribute the load among several machines and make sure that if any Pandora FMS component fails, the system will stay online.
PFMS has been designed to be modular but it is also designed to work collaboratively with other components and to be able to take on the burden of those that failed. The most critical component is the database (MySQL/Percona) that can be configured in Active/Passive mode so that in case of failure, a read-only node is automatically activated and the system continues to operate without pause, and without data loss.
This system is integrated into Pandora FMS console.
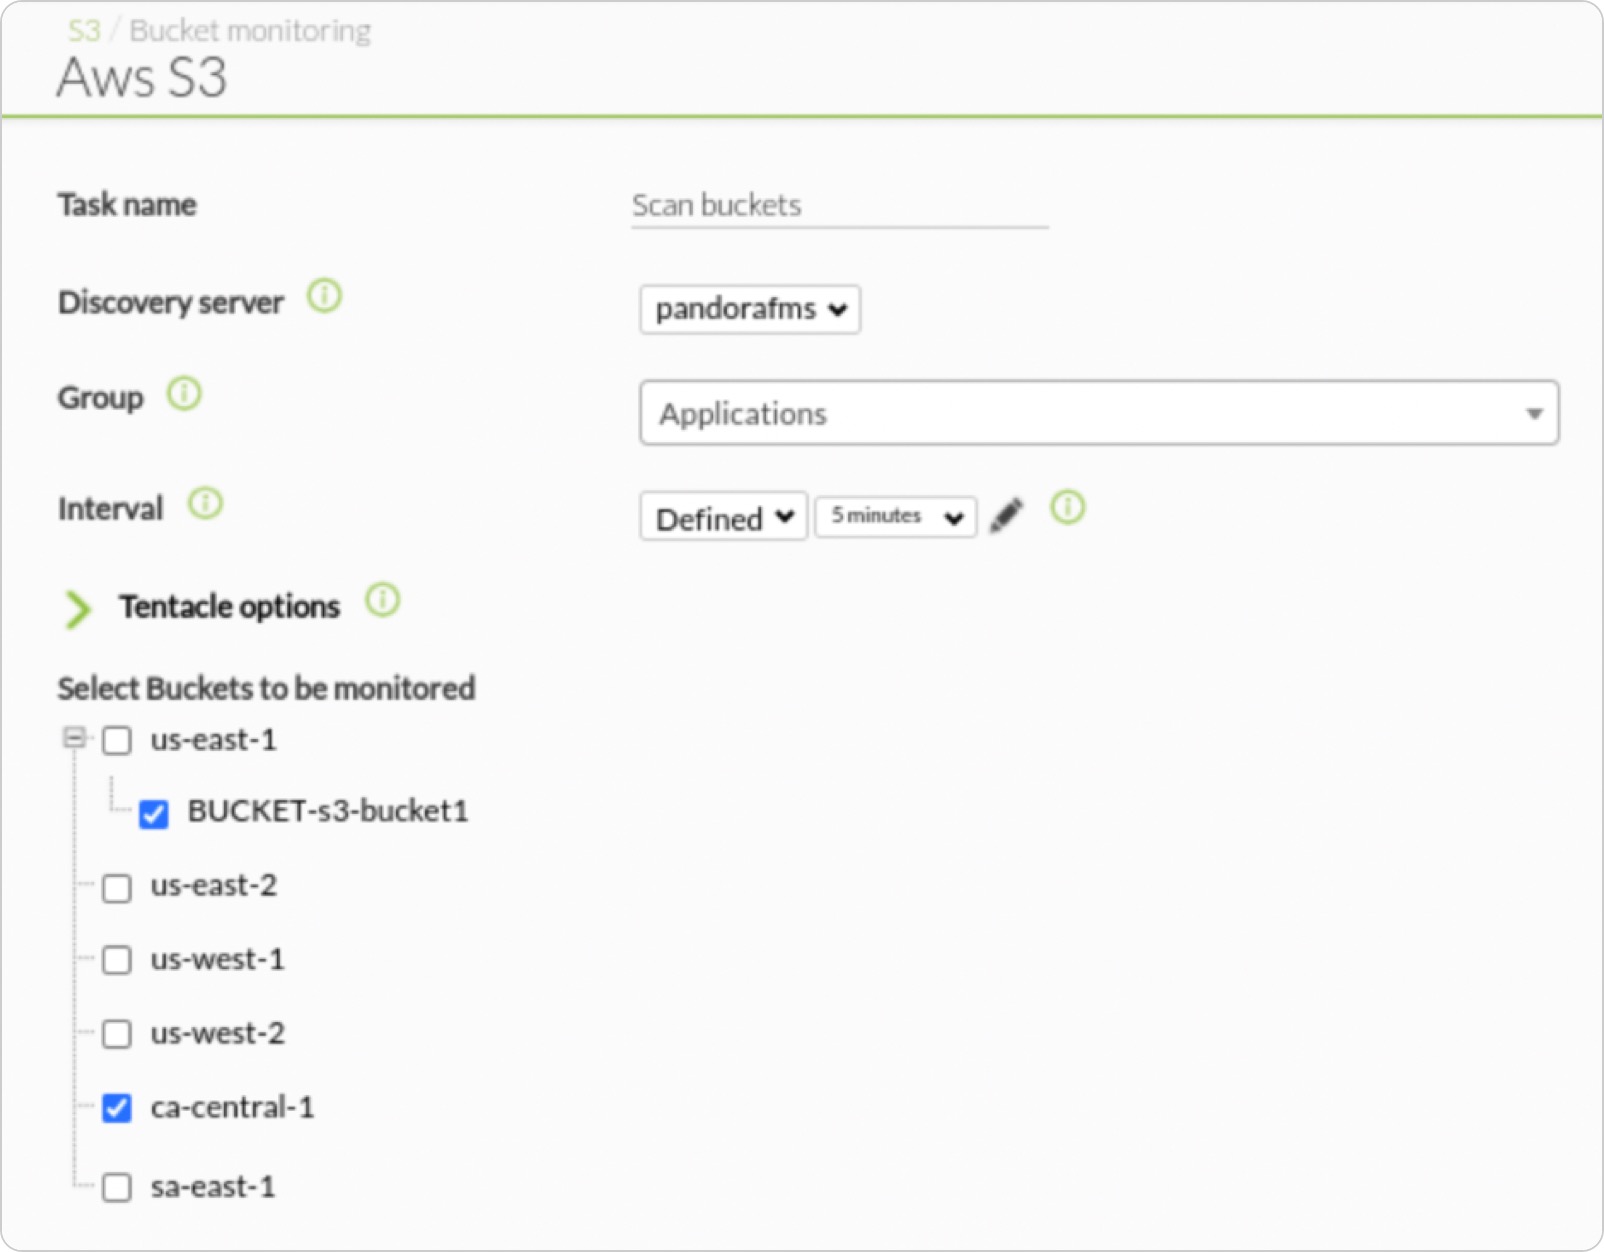
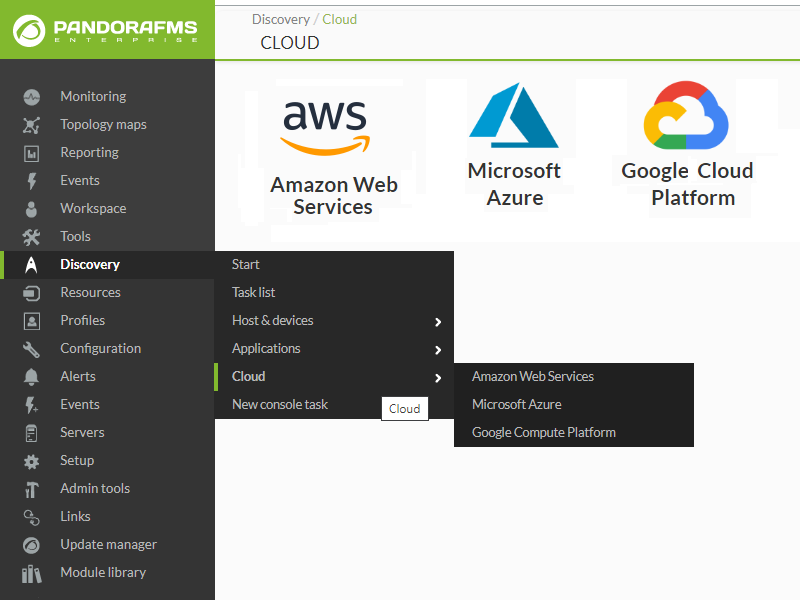
Discovery Cloud allows, through a fully pre-installed and centralized system, to configure native connectors (through APIs) with the most widespread public cloud providers: Amazon, Azure and Google.
You will be able to get it hooked onto your instances and explore the resources available for monitoring: machines, disks, databases and other elements.
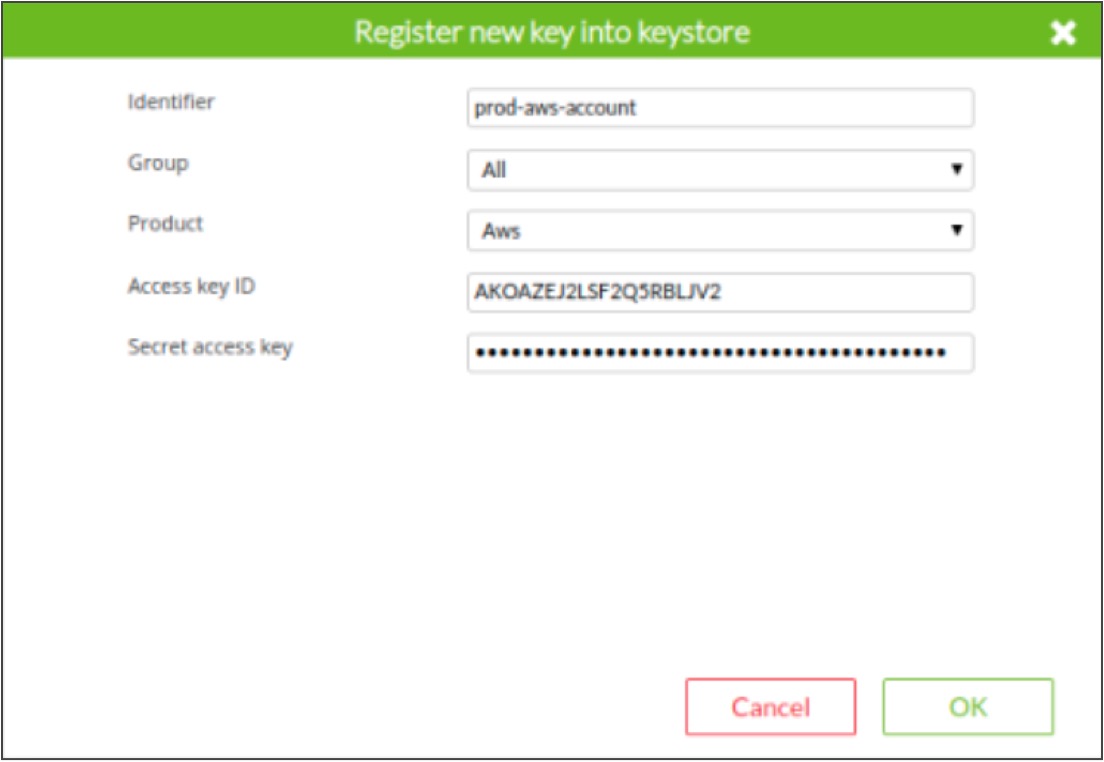
The advantage of this system is that you may get information about the services dynamically, without installing agents. In addition, if you later install agents, you may add both monitoring approaches. Through the credential container system you may even monitor different Amazon instances, for example.
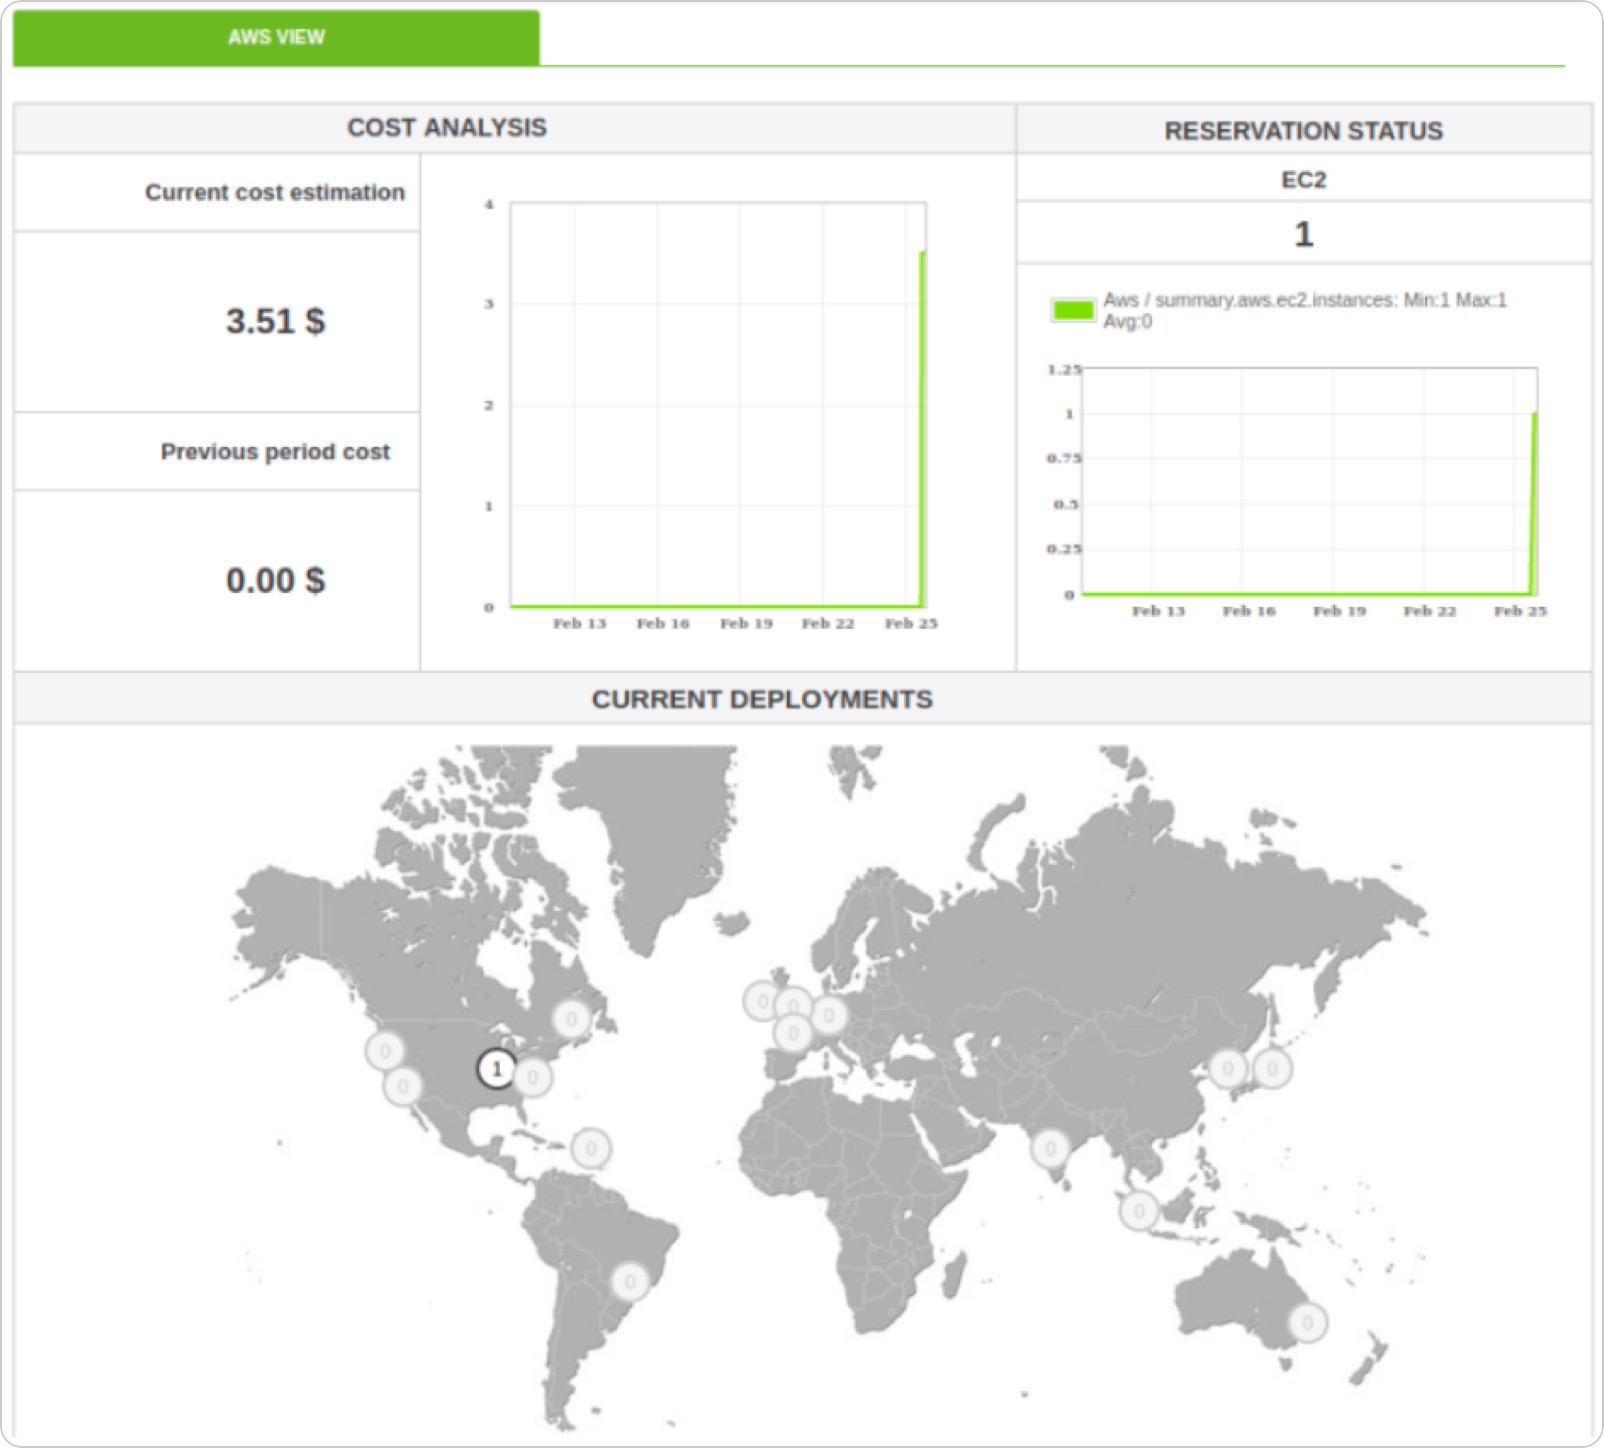
In the case of Amazon, you will also be able to find out the cost of active services.
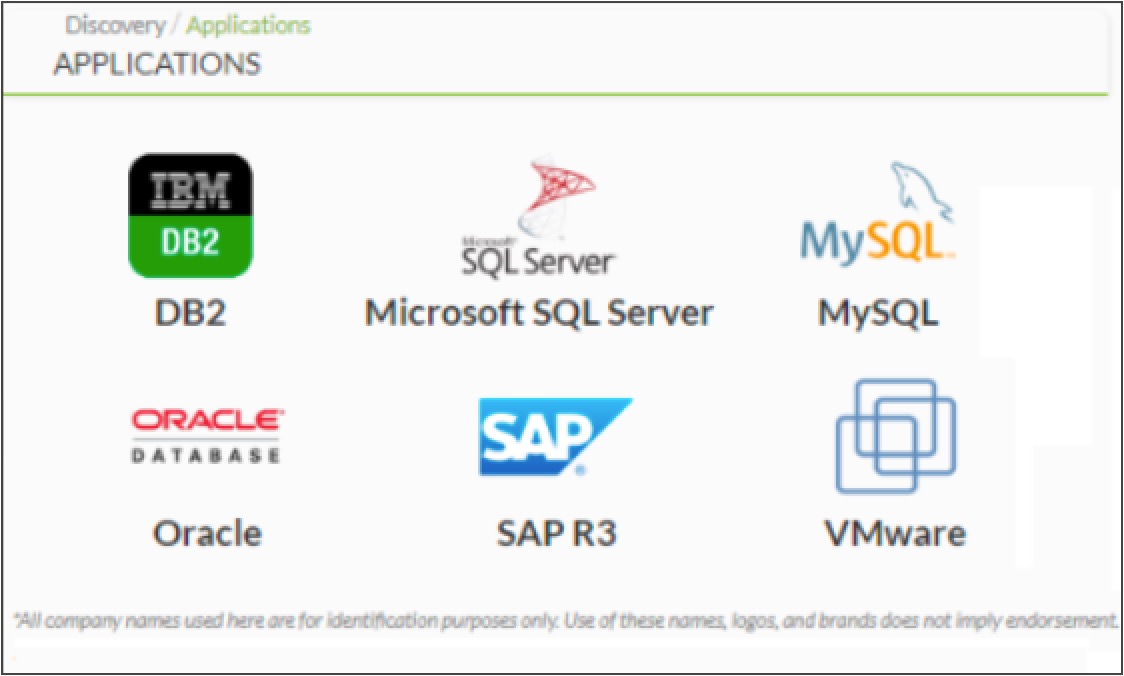
As with cloud providers, Discovery allows out-of-the-box to monitor some extended technologies centrally and remotely: Oracle, SAP R3, DB2, SQL Server, and VmWare virtualization (through the vCenter API).
Along with OEM features, it allows you to customize not only the look, but the feature accessible by all types of users (including administrators). That way you may limit the functions of a PFMS instance, even making the menus disappear.
Pandora FMS Open Source n’est pas un logiciel freemium, il n’est pas bloatware ni shareware (*Clin d’œil pour les personnes nées avant 80 ans). Pandora FMS est publié sous la licence GPL 2.0 et la première ligne de code a été écrite par l’actuel PDG de la société en 2004.
À l’époque, le logiciel libre était en pleine effervescence et MySQL était encore une entreprise indépendante, tout comme SUN Microsystems. Aujourd’hui, il y a des milliers d’utilisateurs de la version Open Source qui téléchargent, régulièrement, des mises à jour via le système que nous lui avons dédié.
Nous n’en savons pas plus sur le sujet (ni leurs noms, ni leurs sociétés…) car, surtout, nous respectons la vie privée. Nous considérons Pandora FMS comme un véritable logiciel libre. Le projet est actif chez Sourceforge depuis 2004 et nous avons tous les prix décernés par cette entité doyenne de l’OpenSource.
Tout le code est disponible sur Github en temps réel, mais le plus important est la documentation que nous avons, disponible en cinq langues (espagnol, anglais, français, japonais et russe) et avec un niveau de profondeur qui vous permet de tirer le meilleur parti sans avoir à payer des certifications, des cours ou des conseils.
Imprimé, le manuel a plus de 1 000 pages (par langue) et est maintenu par notre équipe de développement, Q&A, traducteurs et documentalistes professionnels. Nous avons également un forum public où nous résolvons des doutes, avec plus de 15 000 messages. Nous croyons que la liberté consiste à offrir à l’utilisateur des choix, et non à lui donner des pièces d’un puzzle sans instructions.
Pandora FMS Enterprise
Cependant, Pandora FMS a une partie basée sur une licence commerciale qui étend certaines des fonctionnalités présentes dans la version OpenSource de Pandora FMS. Cette licence incorpore du code source supplémentaire qui n’est pas disponible publiquement ou gratuitement.
Ces fonctionnalités sont destinées aux environnements professionnels exigeants qui nécessitent une certaine automatisation et des outils plus spécifiques déjà créés pour une utilisation en exploitation et avec un support professionnel afin que si quelque chose échoue, ils puissent demander et obtenir un patch si nécessaire. C’est pour ce type d’environnements que nous avons pensé Pandora FMS Enterprise.
Si vous souhaitez utiliser Pandora FMS Community et que vous avez des doutes quant à savoir si cela fonctionnera pour votre organisation : N’hésitez pas, ce n’est pas une question de taille, nous avons des utilisateurs de la version Open, avec des milliers d’agents, qui l’utilisent depuis des années.
Évidemment, le principal avantage de la version Enterprise est que vous aurez quelqu’un pour vous soutenir à tout moment. Soit dans un problème avec une mise à jour ou dans l’installation d’un plugin. Mais il y a beaucoup de petites différences qui peuvent être la clé pour optimiser votre gestion au jour le jour.
Nous décrivons ci-dessous quelques-unes des fonctionnalités Enterprise et leurs caractéristiques.
Si vous voulez les essayer vous-même, vous pouvez essayer une version d’essai de 30 jours, mais laissez-nous vous le montrer lors d’une réunion en ligne et vous éviterez de vous tromper avec le logiciel. Votre temps est précieux et bien que notre documentation soit exhaustive, PFMS possède de nombreuses fonctionnalités.
Les services sont la manière de montrer de manière simple et visuelle comment sont les choses dans votre organisation, classées en différentes entités qui à leur tour se composent d’autres services et/ou métriques.
De cette façon, vous pouvez effectuer une analyse de cause racine automatique et savoir quand un service est affecté, où se trouve l’origine et même le visualiser sous forme d’arbre :
Les services complètent les options de visualisation existantes dans Pandora FMS et permettent aux responsables des systèmes de définir des règles de poids qui comptent sur la redondance de leurs systèmes pour alerter uniquement en cas de besoin, et non lorsque quelque chose d’insignifiant échoue.
Le besoin est apparu chez un client qui gérait de nombreux équipements avec des objectifs et des technologies différents. Il a été constaté que la surveillance des ordinateurs Windows 2000 était différente de celle des Windows 2003 et que, bien sûr, les Redhat Linux avaient des besoins différents des Debian Linux.
En outre, il avait des environnements de base de données différenciés, tels que DB2 ou MySQL.
La surveillance de base pouvait être « compartimentée » dans différents ensembles de contrôles qui pouvaient être standardisés, de sorte que n’importe quelle machine Linux disposant d’Oracle pouvait être surveillée de la même manière.
De cette façon, nous avons fait des ensembles de contrôles qui pourraient être facilement déployés à des groupes de machines.
Grâce aux politiques, il est possible d’homogénéiser la surveillance et de déployer une surveillance standard par technologies.
Ainsi, un système peut avoir différentes politiques appliquées (par exemple : système d’exploitation de base, base de données, application X, performances réseau, etc.) et chaque fois que vous faites un changement de politique, il peut être « synchronisé » avec les systèmes qui sont souscrits à cette politique, de manière totalement automatique.
Bien sûr, des exceptions peuvent toujours être apportées aux politiques au niveau individuel, et chaque système peut avoir un nombre illimité de politiques en plus d’une supervision personnalisée.
L’utilisation de la supervision par politiques peut faire gagner un temps considérable aux administrateurs système.
Si vous avez besoin de vendre votre propre produit de monitorage, avec votre propre marque et une personnalisation totale non seulement de l’apparence, mais aussi des installateurs, du chemin de commande, des services en cours d’exécution, des images d’installation ISO, des agents Windows, des logos, des noms de fabricant et de produit, Pandora FMS Enterprise a différents niveaux de personnalisation.
Le plus basique, et inclus de série dans n’importe quelle licence Enterprise, permet de personnaliser l’apparence de la console de manière à ce qu’elle ne ressemble pas à Pandora FMS mais à votre propre produit, avec votre propre marque.
Si vous avez besoin d’aller plus loin et de générer un logiciel avec un autre nom et qui, du processus d’installation au nom de la base de données, est étranger à Pandora FMS, alors la personnalisation OEM est ce dont vous avez besoin. Nous pouvons même générer des packages de mise à jour spécifiques à votre OEM (ou vous apprendre à le faire afin que vous puissiez vous débrouiller seul).
Pandora FMS Enterprise dispose d’un système de stockage secondaire dans une base de données supplémentaire.
Le système déplace automatiquement les données de plus de X jours vers la base de données historique et, lorsque vous en avez besoin pour créer des rapports ou des graphiques, utilise les deux bases de données pour composer les informations.
Cela permet d’avoir un historique de données presque illimité (plusieurs années) sans compromettre la vitesse d’accès aux données du quotidien.
Si vous avez besoin que votre installation s’appuie sur un Active Directory pour authentifier les utilisateurs, ou pour les créer automatiquement lors de la connexion, en leur attribuant des profils spécifiques ou en les filtrant via une liste noire, cette fonctionnalité est spécialement conçue pour les environnements professionnels comme le vôtre.
Il dispose d’options avancées telles que déléguer à un serveur secondaire, exclure les administrateurs, le compléter par une double authentification via Google Auth et de nombreuses autres options.
Contrôlez et accédez à distance à vos systèmes, qu’il s’agisse de postes de travail Windows, de serveurs Linux ou Windows ou de systèmes embarqués Raspberry ou similaires.
Accédez au shell distant comme si vous étiez devant, au bureau distant ou copiez des fichiers dans les deux sens. Tout cela à partir de la même console WEB de Pandora FMS, entièrement intégrée à la gestion de vos actifs.
Dans la version Enterprise, vous pourrez disposer de votre propre infrastructure on-premise de serveurs eHorus de manière à ce que toute la communication entre vos systèmes puisse être gérée et contrôlée, avec une autonomie totale des tiers et avec la plus grande sécurité et confidentialité.
Cependant, dans la version community, vous pouvez utiliser nos serveurs dans le cloud, jusqu’à un maximum de cinq appareils, gratuitement.
Les serveurs Satellites permettent la surveillance à distance de réseaux entiers d’équipements de manière distribuée et sans connexion directement à la base de données Pandora FMS.
Installez des serveurs Satellites dans les réseaux de vos clients, ils obtiendront des métriques de toutes sortes d’appareils autour d’eux, explorant automatiquement ce qu’ils ont dans leur environnement et envoyant les informations au serveur central, où vous pourrez les gérer comme s’il s’agissait d’agents normaux.
Les serveurs Satellites sont parfaits pour le déploiement sur des sites distants, des bureaux clients ou des environnements inaccessibles. Ils peuvent être installés sur Raspberry ou tout type de conteneur.
Rien de tel que d’observer les choses en prétendant être un véritable utilisateur, si possible depuis la même chaise que le véritable utilisateur. Cela consiste à surveiller l’utilisateur, à répliquer une transaction du début à la fin, étape par étape, à calculer le temps qu’elle prend à chaque étape et à vérifier que chaque étape est correctement terminée.
De cette façon, nous saurons non seulement s’il échoue, mais nous saurons également où et combien de temps chaque étape prend. Nous pouvons même prendre une capture d’écran pour savoir à quoi ressemblait la faute. Cela peut être fait pour les applications Web (même si elles ont Java, Flash, HTML5, etc.), ainsi que pour les applications de bureau traditionnelles.
Cela peut être fait de manière centralisée (WUX) ou de manière distribuée, de sorte que les sondes effectuent les tests à partir de différents emplacements géographiques.
Nous savons que le déploiement et la configuration des agents est l’un des points les plus fastidieux du déploiement de la surveillance.
C’est pourquoi nous avons créé un outil qui permet, en fournissant des informations d’identification, de se connecter à des systèmes Windows ou Linux pour copier l’agent et l’installer sans surveillance. Il vous permet de personnaliser l’installation, par différents réseaux, environnements ou groupes de machines.
Des dizaines à des milliers de systèmes peuvent être installés ou mis à niveau à partir de la console de déploiement d’agents.
Omnishell est une fonctionnalité Enterprise de Pandora FMS utilisée pour l’orchestration (automatisation informatique). C’est un outil entièrement natif et intégré à la console, qui utilise les agents PFMS pour exécuter des blocs de commande sur les cibles sélectionnées.
Un exemple d’utilisation serait de configurer le démarrage automatique du service HTTPD sur les systèmes CentOS 6 en bloc. Un autre exemple pourrait être d’installer un correctif manuel sur les machines Windows que nous sélectionnons dans une liste.
Il peut s’agir d’une ou plusieurs centaines de machines.
Auto provisionnement et configuration automatiques des agents
Il met en œuvre un mécanisme automatique par lequel vous pouvez appliquer des politiques et des modifications aux agents nouvellement provisionnés, de sorte qu’après le déploiement, la configuration de la surveillance soit automatisée, en lui assignant un(des) groupe(s), des politiques de surveillance, des alertes, etc.
Cette personnalisation se fait sur la base de règles. Par exemple, avoir une certaine gamme d’adresses IP, une marque ou un champ personnalisé spécifique ou un nom d’hôte avec une certaine tendance. En outre, après avoir effectué le changement de configuration, une action personnalisée peut être générée.
Ceci est parfait pour intégrer n’importe quel processus de mise à disposition de systèmes dans la supervision.
Déployer des supervisions avancées nécessite d’apporter des scripts et de petites applications (les nôtres, les vôtres ou celles de tiers) aux systèmes surveillés, pour être exécutés par l’agent sous forme de plugins.
Les collections permettent de regrouper cet ensemble de fichiers et de les transporter aux agents de manière intégrée dans les politiques.
De cette façon, l’utilisation de plugins est simple et transparente pour le fonctionnement final.
Pandora FMS peut collecter des journaux à partir de n’importe quelle source compatible avec syslog ou via des agents logiciels (Windows et Linux). Ces journaux peuvent être des fichiers texte bruts ou des événements système Windows.
Ils seront collectés par l’agent de supervision Pandora FMS et envoyés au serveur avec les données de surveillance. Ainsi, si vous avez déjà des agents installés, vous pouvez collecter les journaux de ces systèmes facilement et rapidement, sans logiciel ni licence supplémentaire.
Contrairement aux données de supervision stockées dans une base de données SQL conventionnelle, les journaux sont stockés dans un système Elastic indépendant.
Vous pourrez stocker des gigaoctets de journaux et les conserver longtemps (vous n’aurez besoin que de plus de disque). Vous pouvez définir des alertes ou effectuer des recherches parmi vos sources de données. C’est le complément idéal dune surveillance exhaustive, et totalement intégrée à la console.
L’inventaire PFMS vous permet d’obtenir des données de nombreux types : packages de logiciels installés, utilisateurs ayant accès à l’ordinateur, correctifs installés, périphériques matériels, firmware et version du système de base, licence ou numéro de série, etc.
Les alertes vous permettent de générer des actions si vous trouvez ou ne trouvez pas certaines données sur un ordinateur avec des informations d’inventaire (liste blanche / liste noire).
Par exemple, que se passerait-il si vous saviez qu’une version vulnérable existe sur vos systèmes ? Vous pouvez créer une alerte qui vous avertira si quelqu’un l’utilise. Ou au contraire, si vous avez besoin qu’une application soit installée sur tous vos systèmes et que quelqu’un ne l’installe pas, vous pourrez le savoir en temps réel.
Le Command Center est le joyau de la couronne de Pandore FMS.
Il sert à contrôler de manière centralisée un nombre illimité d’instances Pandora FMS indépendantes (chacune avec son serveur, sa console et ses bases de données), de sorte que vous pouvez gérer des dizaines de milliers d’agents à partir d’un seul point, tandis que ces systèmes sont à leur tour gérés par des instances indépendantes.
Ce système de gestion fédéré garantit l’uniformité et la facilité de gestion.
C’est un système robuste où la chute d’un système n’affecte pas les autres systèmes, où la croissance est entièrement horizontale et répartit automatiquement la charge. Nous avons des clients avec plus de 40 000 agents et plus d’un million de mesures collectées.
Dans les environnements critiques et/ou à forte charge, il peut être nécessaire de répartir la charge sur plusieurs machines et de s’assurer que si un composant de Pandora FMS tombe en panne, le système reste en ligne.
PFMS a été conçu pour être modulaire, mais il est également conçu pour fonctionner en collaboration avec d’autres composants et être en mesure de prendre en charge la charge des composants qui ont échoué.
Le composant le plus critique est la base de données (MySQL/Percona) qui peut être configurée en mode actif/passif afin qu’en cas de défaillance, un nœud en lecture seule s’active automatiquement et le système continue de fonctionner sans interruption, et sans perte de données. Ce système est intégré à la console Pandora FMS.
Discovery Cloud permet, via un système entièrement préinstallé et centralisé, de configurer des connecteurs natifs (via des API) avec les fournisseurs de cloud public les plus répandus : Amazon, Azure et Google.
Vous serez en mesure de vous engager avec leurs instances et d’explorer les ressources disponibles pour leur surveillance : machines, disques, bases de données et autres éléments.
L’avantage de ce système est que vous pouvez connaître les services de manière dynamique, sans installer d’agents. De plus, si vous installez ensuite des agents, vous pouvez ajouter les deux approches de la supervision.
Grâce au système de conteneur d’informations d’identification, vous pouvez même surveiller différentes instances Amazon, par exemple.
Dans le cas d’Amazon, vous pouvez également connaître le coût des services actifs.
Comme avec les fournisseurs Cloud, Discovery permet de surveiller certaines technologies étendues out-of-the-box de manière centralisée et à distance : Oracle, SAP R3, DB2, SQL Server et virtualisation VMware (via l’API vCenter)
Outre les fonctionnalités OEM, il vous permet de personnaliser non seulement l’apparence, mais également les fonctionnalités accessibles par tous les types d’utilisateurs (y compris les administrateurs). De cette façon, vous pouvez limiter les fonctions d’une instance PFMS, même en les faisant disparaître des menus.
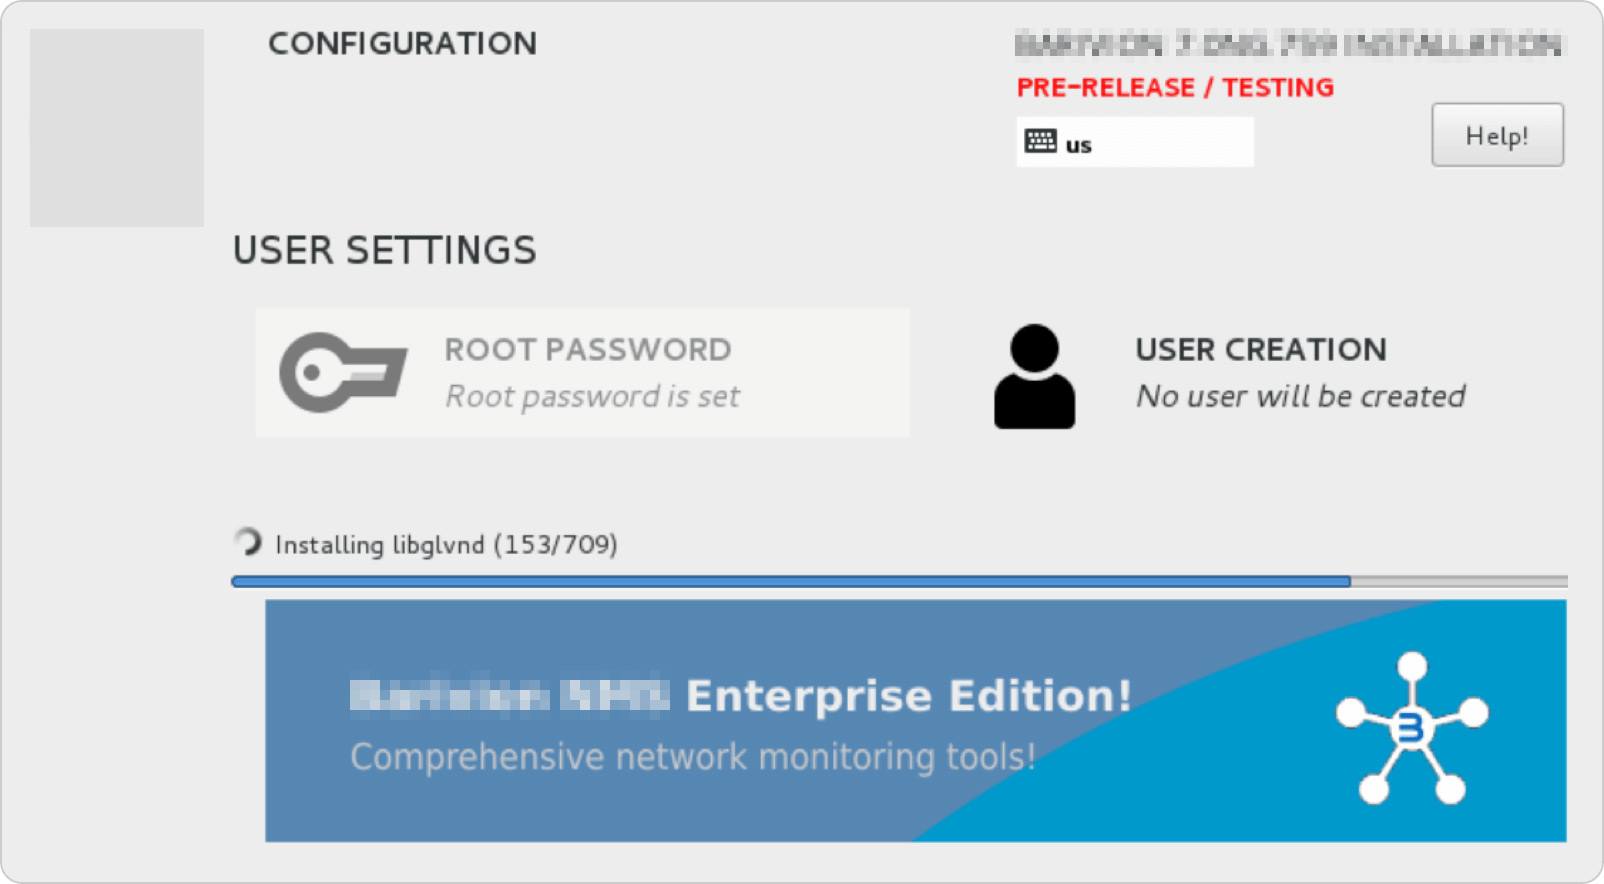
In this workshop we will see the new unattended Cloud installation model in Red Hat 8 (supported by Rocky Linux 8), for Pandora FMS environment fast deployment.
Cloud installation. You’re not the only one who lives up there!
You will only need to have a single Red Hat 8 instance enabled and an Internet connection to run the installer.
Another point we will see will be the agent installer in Cloud format for systems based on Red Hat and Debian.
The new Cloud installer is the new official installation method we have in Pandora FMS.
We switched from an old Isos system to something more Cloud-oriented.
The idea is simple, that any instance of any provider, whether On premise or any public cloud provider, can be installed in Pandora FMS easily and quickly.
Check out our video and ask any questions if you have any left!
Has it happened to you that with the release of a new version of your favorite application some feature disappeared? Or it works but unexpected things happen when you execute it? Or does it just crash?
Today we will see what the possible tests that guarantee to avoid all of this are: regression tests.
You still don’t know what regression testing is?
There are many rules for testing software, and you may be surprised to learn that there’s even the documentation job of testing software.
*I leave you here a few seconds to surprise you…
And not only that, my friend, there are international organizations that are devoted to studying and making general recommendations.
*For example, standards ISO/IEC 29119 roughly state what software testing processes should be.
For several decades I have been fascinated by all these processes, including monitoring industrial devices, to such an extent that I stick so much to them that they always call me a perfectionist, me!
I will remind you that the design and construction of any machinery, even today, is carried out by human beings whose lives depend on their proper functioning!
Cars, air conditioners, power plants that cool homes in hot summer…
For that reason software tests must be adapted to the work itself that these programs will carry out:
A program to automatically fly an airplane? Rest assured that you will be subjected to very thorough testing.
A banking software? It will be tested and will have a special section for testing the corresponding audit software.
A video game software? No one will die if something goes wrong, worst case scenario players will buy the game from the competition, but who wants that, gamer fella’?
That is why I would like to explain to you, in the simplest possible way, what these processes and tests are all about.
Unit tests, re-approval and reanalysis
Let’s quickly see some key concepts:
Unit tests:
Unlike the last century, we have better hardware at our disposal, which allows for automated, full and fast tests, which can be reused again and again (and run independently) for the source code itself.
A comma, a pair of parentheses may be misplaced or well placed depending on the version of the programming language used (for example, see in Python the command print). For this, unit tests are performed.
Process of reapproval:
When a software is modified, whatever the reason, each and every one of the points that have been worked on must be reapproved.
Said tests are always done manually.
Reanalysis process:
If the previous point is suspended, the software will be returned to the development department specifying what its malfunctions are.
Once they have been corrected and delivered, they will be reanalyzed and, if everything’s correct, they will be reapproved.
No more preambles! What is a regression test?
Regression tests are totally different from the previous tests.
They are called that way because they come from the principle that if a software works as expected, and is altered either internally or externally, then you have to make sure that it returns to its previous stability state.
*When we say that a software is stable and works as designed, we are talking about everything as a whole, overall.
Therefore, a regression test must be applied to each and every component.
As you can imagine, this is a titanic task, but if done well, it will help improve user experience and gain customer confidence.
When to perform a regression test?
When a new feature is added to a software, the reapproval and reanalysis tests are performed, a regression test must be performed before delivering it to the customer.
And also when:
The requirement changes or was misunderstood by developers and then a feature has to be “repaired”.
The software has passed a regression test, is delivered and works very well until something changes.
*For example, the user has upgraded the operating system or migrated to a newer version: the program suffers a bug that needs to be fixed.
The software does its job but over time data accumulates and it takes more and more time to execute the same tasks.
Optimizing the source code is then required and the entire test cycle is repeated again.
Depending on each country there will be new legislation and the software will have to comply with the extremes of law. In this case the software is refurbished and a regression test will be necessary before being re-legalized.
You need to port the software to a different operating system (e.g. GNU/Linux® to MS Windows®) in order to sell it to more customers. Here the same regression tests will also be copied and adapted to the new environment.
Some disadvantages of this type of regression test
Not everything was going to be good news:
The slightest change has to be tested in a regression test.
Even without any changes in the source code of the software.
As monitoring works, there will be simple and some more complex features, which can be a problem if you have a time limit.
For example, monitoring a web page can take milliseconds if it is about doing a ping or getting a specific value, but in the case of user experience monitoring you will have to record each of the tests to be performed.
Once you have automated regression testing you may need to perform a manual test, this will result in more time and money being spent.
Pandora FMS is an international entity and needs activity. And seeking that activity we set our eye on that great technological power, the United States.
How does one approach the United States?
Well, in multiple ways…
Among them: having a team from that capital nation, with five senior professionals who are doing their MBA final project.
The University of Rice from Texas contacts you. You sign up for their program and then wait for them to choose you as their project.
And bingo!
To date we have had several meetings with this team of five professionals. We already explained who we are, in what we work, our product strategies, marketing, sales…
And they answered us:
“We are going to help you get into the USA market with our project, a specific marketing plan for the US market that includes, above all, communication strategies.”
Things have gone so well between us that after a month and a half working remotely, we have met here, in our offices in Madrid, to finish clearing out issues and see the presentation of their final proposal.
In addition, one of them, Sean Siegfried, has granted us an interview for untiring fans of this blog who love to follow every little detail of our trajectory.
Here we go!
Pandora FMS and the U.S.A.: the Interview
Could you tell us briefly about you: from where you come, what you do?
I was born in Brazil and I grew up in Portugal. I completed my degree in London before beginning my career in the industry of oil services. During the last 12 years I have moved between South America, North America and now the Middle East. At the moment I am the Managing director of a private company in Saudi Arabia that lends manifold services to the greatest world companies, Saudi Aramco.
What brought you to Pandora FMS?
Rice University connected us with Pandora FMS for our last masters project.
It was a consulting project of four weeks in which we studied how we could help Pandora FMS to get their way around and to obtain more market quota in the USA.
Could you describe what your project consists of?
The project consisted of understanding the business of Pandora FMS and how it could expand its operation and market participation in the USA market.
The main motivation was to research and create a possible action plan for Pandora FMS to use in the future.
In addition to providing sufficient tools that make management understand the multiple opportunities that are available with the research that was conducted during the eight-week period.
What were the biggest challenges during the project?
The biggest challenge for the team was to understand the capabilities and advantages that Pandora FMS could bring to the US market.
Once the team understood the applications, they had no difficulty identifying specific segments or specific areas where Pandora FMS could really make a difference when trying to get into the IT monitoring market.
What surprised you the most about our business?
The amount of competition that Pandora FMS has all over the world, and that even despite this, it still has such a strong customer base with large corporations.
What do you think are the essential features that would make it possible for Pandora FMS to succeed in the United States?
Especially the cost structure and ability to scale slowly if necessary.
What is the most relevant lesson you have learned from this experience?
Meeting a small but dynamic team with amazing features.
There is no doubt that the company can slowly grow with the cost base it has now.
How would you recommend Pandora FMS to technology experts?
With this motto: “The best technology, reliable and affordable, to better monitor your organization.”
Here comes a difficult question: Can technology touch the heart?
I’m not sure how to respond to this, but if technology solves a problem, then it will have a positive effect on the customer.
In my honest opinion, I believe that technology can touch the heart on the side of the creator/investor.
Is there anything else you would like to comment or say about Pandora FMS or the business?
I think more money should be spent on marketing and branding.
And make the effort to participate in global forums to better understand what the needs of the market are.
And, of course, more importantly, expand the brand footprint across multiple segments.
Finally, what do you think of our country?
After spending my life in Portugal, I was lucky enough to visit Spain multiple times.
I really enjoy the food and walking through the streets of Madrid!
In general, it was a great experience to share with my classmates!
The public service of buses of Madrid, the EMT, was one of the protagonists of Global Mobility Call that took place the 14th and 16th of June in IFEMA. The company from Madrid exposed its future plans tracing the route to continue transforming the capital into a Smart City where sustainable mobility and independent vehicles acquire great relevance.
Nevertheless, executing this plan would be impossible without a technology characterized by generating data on a steady basis.
That’s why the city has taken its chances on data control through monitoring. This is the secret for the success of the EMT, that already has established a monitoring system thanks to Pandora FMS.
Pandora FMS, the great secret for Madrid’s EMT success
The EMT counted on a system based on a central HOST, that is to say, a computer or a set of computers around where all the information circulated and to which others connected.
But, after a remarkable enterprise growth, this system became ineffective before an activity that seemed uncoverable, the reason why they were forced to change their IT infrastructure management.
The public transport company confronted a remarkable technological growth of buses and users, and they set the goal of having a trustworthy control over the whole system, both the hardware and the processes that take place.
And it was there where monitoring came up, that is to say, the reception and analysis of data and their management by means of a central console.
In other words, the EMT needed a system that canalized all the information to a single computer from which to access all the interconnected technology, and the agreement with the Spanish company Pandora FMS made such a solution available to them.
Through the alliance, the regional public giant managed to reduce costs and improve its service until becoming a reference in public transport for the smart cities of the future, as it has been shown in the Global Mobility Call.
“The EMT needed to remarkably improve the management of all the information.
It must be taken into account that its fleet is made up of more than 2,000 buses and that tens of thousands of users use this type of transport daily.
To satisfy this high demand they leaned on evolution to implement a monitoring system able to adapt to the systems the EMT already had in motion, but that could be able to coexist with future developments”,
explains Sancho Lerena, CEO of Pandora FMS
This monitoring system allows, among other things, to improve the process of checking bus availability through applications, thanks to which the user can see how much is left before the bus arrives from their phones.
It also makes it easy for maintainers to manage with real-time information on each machine, its performance, and its status.
By means of Pandora FMS technological solution, not only does it increase the control that exists over the fleet, but it also achieves better response to any incident apart from preventing possible breakdowns, which reduces the impact on the end user and maximizes the benefits.
“When this monitoring system is implemented in the EMT, a watchdog agent is also established that reduces workload.
What is achieved with this mechanism is that there is no need to carry out periodic checkouts to see that the system is working correctly and that, in the event of an error, it can be alerted in time to act and prevent similar ones”,
highlights the head of Pandora FMS.
EMT Madrid now has control of each bus, which by means of LAN networks constantly dump information to the central.
A step that in just a few years will be left behind, since they intend to improve data management until knowing in real time the capacity in each bus or even establish some that are completely autonomous.
A series of innovations that are framed within the goal of smart cities, where the use of technology for the efficient development of services is the fundamental pillar.
The power of real-time data
Investment in technological development has only just begun.
In the coming years, the use of 5G will end up being established, which allows higher connectivity and higher speed in the use of this type of networks.
In turn, this scenario will increase the ability of systems to obtain data in real time. And, therefore, service management itself may be more efficient by having the option of adjusting to the behavior of users with a correct monitoring system.
Madrid, which has reaffirmed in the Global Mobility Call its image of smart city, is already working on creating a digital twin (a virtual recreation of the city) that allows us to find out the movement that takes place in the distribution of its logisticmicrohub.
That way, as with the other services, circulation can be anticipated and improved and, therefore, more efficient and sustainable mobility is achieved.
Let’s check out together the new features and improvements included in the newest Pandora FMS release: Pandora FMS 763.
What’s new in the latest Pandora FMS release, Pandora FMS 763
NEW FEATURES AND IMPROVEMENTS
New service evaluation option
A new token has been added to be able to choose which services are recursively calculated and which ones are uniquely evaluated with a separate interval to improve the thread load of the service status calculation.
OS Quick Report
A new widget has been added to the dashboards, “OS Quick Report”.
Through this widget you may get a table that will perform counting by the different operating systems that you’re monitoring
Sunburst, new service representation
The possibility of a new service representation has been added.
This will be a centralized view where you may see the details of the tree node through a tooltip when hovering with the cursor.
New Azure Storage plugin – Enterprise plugin
With this plugin you may monitor a storage account and retrieve data from it such as the number of transactions, capacity or latency used by Azure to process a successful request.
It will retrieve data both at the general account level and from blobs, tables, files, and queues.
With this plugin you can retrieve performance and connectivity data from any Azure SQL database. Such as the CPU used, failed or successful connections or firewall blocks.
With this plugin you may get the statistics of each volume and the bricks of a gluster fs environment. Some of the data that you may see are the total disk, Ordblks or Smblks.
You already know that in this house we love comparisons. Somehow you have to elucidate which is the best monitoring tool on the market, right?
Well, this time we bring you the final battle between three great ones. Prometheus vs Nagios vs Pandora FMS. Nothing like that had ever been seen before in the ring!
Prometheus vs Nagios vs Pandora FMS, the final battle
What is Prometheus?
Prometheus seeks to be a new generation within open source monitoring tools.
A different approach with no legacies from the past.
*You know, for years, many monitoring tools have been related to Nagios by its architecture and philosophy or directly for being an total fork (CheckMk, Centreon, OpsView, Icinga, Naemon, Shinken, Vigilo NMS, NetXMS, OP5 and others).
Prometheus however, is true to the “Open” spirit: if you want to use it, you will have to put together several pieces.
Somehow, we can say that like Nagios, it is a kind of Ikea of monitoring. You’ll be able to do lots of things with it, but you’ll need to put the pieces together yourself and devote lots of time to it.
Prometheus is a data collection tool that works with time series data.
Many companies that need to integrate a tool into their developments and operations choose Prometheus as their primary source of monitoring data because it easily adapts to most software architectures, quickly integrates with most modern technologies, and becomes a kind of data acquisition and management middleware standard.
It is usually integrated with Grafana to display data, as the Prometheus user interface is quite basic.
What is Nagios?
Nagios is a classic reference in IT monitoring. You can already see some previous comparisons of ours, with this tool.
What is Pandora FMS?
Pandora FMS is an all-in-one monitoring software used for both IT monitoring and integrating monitoring processes of all kinds, from IoT projects to business tracking projects.
Features
Prometheus and Nagios/Pandora FMS on the other hand offer many different features.
The type of data Nagios works with is very closed and focuses on states, being able to collect numerical metrics.
Prometheus in raw data.
Pandora FMS manages both with flexibility, although Prometheus is undoubtedly the most flexible when it comes to managing open data.
Prometheus collects data from applications that send metrics to their API endpoints (or exporters).
Nagios uses agents that are installed on servers and through SNMP checks. It has a large and heterogeneous plugin system to collect data from other sources. One of its great virtues is this ecosystem (Nagios Exchange).
Pandora FMS has a more centralized system for remote polling (SSH, WMI, SNMP, web transactions, etc.) and is much more convenient to manage by its unified web interface.
It also allows, like Nagios, to collect logs and process Netflow data streams, which Morpheus does not even contemplate.
Reports and control boards
As we said before, the charts and dashboards provided by Prometheus do not meet the current needs of DevOps that are very focused on creating their own dashboards, charts with combined data, and generating screens that serve to show other people.
Many Prometheus users use other visualization tools to display metrics collected by Prometheus, often Grafana.
Nagios comes with a set of dashboards that conform to the monitoring requirements of networks and infrastructure components.
However, it lags far behind in this area. Although it has visual screens and other third-party plugins for reporting, it is perhaps one of its weakest points.
Pandora FMS, however, has excellent graphics, custom dashboards (dashboards) and visual screens (Visual Console) that allow you to customize the appearance of the collected data.
On the other hand, its system of templates and reports is extremely powerful and flexible, especially regarding Top-N type reports, different SLAs and all kinds and examples of charts, lists and summary tables.
Nagios XI
Grafana + Prometheus
Pandora FMS
Management, configuration, operation, installation and update
Perhaps this is the big difference between Pandora FMS on the one hand and Prometheus and Nagios on the other.
While in Pandora FMS 99% of the configuration is through a graphical interface, with Prometheus and Nagios you will have to deal with configuration files and constant reboots.
The same happens when you want to update, it is a process that requires Linux knowledge and managing with the shell.
In Pandora FMS, it is fully automatic.
As for Pandora FMS initial installation, it can be done using a docker or an online installation with a single command.
In Prometheus and Nagios the installation can be tedious although preconfigured images already exist with Docker.
None of the three tools is click & play anyway. None is a toy that can be simplified since all three are powerful multipurpose and extremely versatile tools.
Community
Prometheus has been growing in recent years, and has more and more extensions.
However, the leader in this category is Nagios, who remains the reference of the community and has the largest library of extensions. Although Pandora FMS already has a large library of plugins (mostly Enterprise applications), it is behind that of Nagios.
What will you miss in Prometheus?
Particularly, reports, dashboards and a centralized configuration management system.
An interface that allows observing and monitoring grouped information in services / hosts.
Actually, in order to do something you will have to install Prometheus and a set of applications to integrate them together.
What will you miss in Nagios?
A centralized management interface. Wizards, customizable reports and above all, unified management of agent configuration.
What are the great disadvantages of Prometheus over Nagios or Pandora FMS?
Prometheus is designed to work with data.
It has no statuses, no service groupings, and you will not have a view that respects a hierarchy of elements that you can associate with your organization (networks, system groups, hosts).
Prometheus is a data processing ecosystem, not a common IT monitoring system.
Its power in data processing is far superior than that of Nagios, but the use of that data for day-to-day use makes it extremely complex to manage, as it requires many configuration files, many external commands distributed and everything must be maintained manually.
The graphical interface also does not help, as it is excessively simple and does not allow you to configure anything.
We can say that like Nagios, it is a kind of monitoring Ikea, and that Nagios is much more limited in terms of its data processing power, but much more specific when it comes to using that data for something useful and visible.
Conclusion
Comparing Prometheus with Nagios is not fair as they have different approaches, Nagios is much more prepared for traditional IT monitoring, in less time, with less complexity and with more understandable results, even though it is older technology and with a much more rigid architecture that becomes difficult to integrate with the requirements of today’s hybrid environments.
Nagios and Pandora FMS have more resemblance to each other than either of the other two.
However, Pandora FMS integrates better than Nagios with external development processes, since like Prometheus, it also works with raw data as a source of information.
On the other hand, like Prometheus, Nagios has many “additional” interfaces that are ultimately needed to display maps, graphs, and other types of reporting.
In Pandora FMS everything is “included” as standard: reports, dashboards, dashboards, graphics, etc.
Prometheus has two main advantages over Pandora FMS and Nagios: the fact that it is designed to be part of an integration and its ease of use by having far fewer features.
Its main disadvantage is its poor scalability and the fact that many of the features of Nagios and Pandora FMS just do not exist in Prometheus, especially in network monitoring or in reporting.
For their MaaS Solution (monitoring as a service), Pandora FMS partners with OVHcloud to ensure data sovereignty, European technological independence and top quality service with datacenters in Europe, America and Asia.
Learn all about Monitoring as a Service (MaaS)
Pandora FMS, the renowned Spanish technology company, launches its SaaS solution on the market: MaaS, Monitoring as a Service, a flexible subscription model, easy to understand and that covers all the monitoring needs of companies of all sizes.
The MaaS Solution complies with easy integration with business processes, permanent security and 24/7 availability, to be accessed anytime and anywhere.
A crucial weapon to safeguard companies from the growing demand for the Cloud, and the difficulties of finding personnel to manage the ever-increasing technological complexity.
Particularly, since it is well known that the use of heterogeneous tools and the lack of use of AI in multi-cloud environments prolongs and delays innovation, forcing IT teams to devote almost half of their time to maintenance tasks.
In collaboration with OVHcloud
Since 1999, the year of its foundation, OVHcloud has had a single objective: to offer their customers a complete range of innovative Cloud products and bare metal with a marked European accent.
Since then, the group has provided world-class infrastructures to more than 1.6 million customers worldwide, and has an ecosystem of partners who bring in their added value to accompany the digital transformation of different companies.
Pandora FMS is incorporated asAdvance Partnerfrom OVHcloud, combining its extensive experience in IT monitoring software with the sovereign infrastructures of OVHcloud, and includes its ready-to-use solutions in the Marketplace of the European Cloud leader.
At the moment, OVHcloud’s powerful high-end dedicated servers are helping Pandora FMS provide its customers with its MaaS service: a service with very high standards by offering 24/7 operation.
Thanks to the smooth operation and reliability of this product, they can also comply with the SLA of the services offered hosted on these servers.
“The ease of provision, the transparency and the wide range of options that OVHcloud now has to choose, not to mention the possibility of having servers in Europe or America, is key to deploying our solutions,” tells us Sancho Lerena, CEO and founder of Pandora FMS. “In addition, it is a pleasure to be part of the OVHcloud ecosystem, and contribute jointly to the promotion of innovative, interoperable and trusted solutions. One more way to try in face of all the range of possibilities of our MaaS Solution,” concludes.
Pandora FMS
Pandora FMS, as many of you know,is the total monitoring solution, which allows you to observe and measure all kinds of technologies regardless of where they are located: Cloud, SaaS, virtualization or on-premise: a flexible solution that unifies data visualization for full observability of the entire organization.
With more than 50 thousand facilities in 53 countries, among its customers there are companies such as:
Salvensen
Prosegur
Repsol
CLH
Euskaltel
Adif
Santalucía
Cofares
AON
El Pozo
The EMT
And other foreign companies such as:
Rakuten
Nazareth University in New York
Ottawa’s main hospital
Also, public administrations such as:
La Junta de Castilla-La Mancha
Community of Madrid
La Diputación de Barcelona
And numerous municipalities in France, Portugal and Spain
*Yes, we don’t even take the time to explain what digital clouds are anymore and we even assume that everyone has their own, small but they have them.But when it comes to doing things big, it’s unavoidable to mention the giant Google Cloud®!
Pandora FMS and the famous Google Cloud monitoring
Pandora FMS® (PFMS) during the year 2020, in the midst of the pandemic, walked slowly but without any pause, their team did not stop at all.
API Platform: Everything necessary for third party companies to communicate with all the paraphernalia of Google services and applications. *If you don’t know what an API is,here’s what you need to know.
*The latter is important, your wallet, not artificial intelligence. Because it is necessary to direct debit a bank account, or a good credit card, the payments of all these services.
**At the time of writing, I do not know if the new Google Pay (formerly called Google Wallet) is accepted as a means of payment (most likely, because it is from the same company).
In the case of Pandora FMS monitoring of Google Cloud it is only available for the Enterprise version.
But erase those sad faces because you can request a 30-day free trial by accessing this link!
Again the change
If there’s one thing that characterizes Google since I saw it born, it’s the constant change.
As well as the number of products and services they have is immense, no less small is the number of them that have been discontinued or withdrawn from the catalog.
While I still keep my Hotmail email account (not available to new users), Google at most has come to offer some product similar to the one they withdraw, accompanied by a package of instructions for us to do the data migrations.
When they say it’s over, it’s over.
Therefore, dear readers of the future, if this has happened again, please write it down in the comments below.
At PAndora FMS we have IT professionals on an altar. Literally, one next to the water dispenser in the office. I’m serious! It even has its blessed liturgical cloth, its flattering parsley, its candles and the incense! But there are still things that these people miss. Here’s a hint: it’s related to ITOM.
IT Operations Management (ITOM) and automation
We all agree in the industry that IT professionals waste too much time every day, struggling with minor tasks within IT Operations Management (ITOM).
And it is that ITOM covers everything necessary to support the network infrastructure that provides IT services.
This includes both the hardware (switches, servers, data center firewalls…) as well as the company’s network and the tools needed to make sure everything works properly.
According to the latest surveys, 78% of IT professionals say they spend at least 10% of their time proactively optimizing their environments.
This extra time spent on maintenance and conservation obviously takes time from proactive optimization.
And this is where automation comes in.
Automation is that miracle from heaven that sets IT professionals free to stop wasting time and focus on things that really matter, and not on boring tasks!
Of course, most IT professionals know firsthand the value of automation.
That’s why they have their altar. *Visitable during working hours, and donations are accepted.
But automation has not yet reached ubiquity regarding ITOM.
And it’s time for that to change!
That’s why we want you to start considering automating the following types of tasks:
Complex tasks with multiple steps
Repetitive routine tasks or tasks triggered by a recurring event
Tasks where a large amount of data needs to be filtered based on specific, predefined criteria
As we said, in these cases, automation can help the incredible intellects of IT professionals, and their almost intrinsic creativity to focus on other needs. Perhaps, even with automation, you will minimize the possibility of human error in tasks.
What is the next step?
Certainly the next step is to consider which are the most relevant ITOM tools.
If your megalomaniac goal is, for example, to optimize a large government network, look for the products best designed to scale and then make sure the vendor and product are approved for use in government networks.
Here, for example, the most relevant ITOM tools could be:
Performance monitoring
Configuration management
Security and intrusion detection and prevention
Troubleshooting
If you then relax and have a tea and take enough time to consider specific processes that can benefit from automation, such as automating network configurations, you may help out your IT professionals do more efficiently tasks like:
Meeting compliance requirements, implementing configuration changes quickly and efficiently, or reducing downtime caused by faulty devices.
And network configuration automation is only one area from among them all.
Think about the possibility of automating workflows and your IT staff crying dramatically when finally getting their lives back!
Or automating tasks initiated by mobile devices, etc.
Prepare for change!
Naturally, automation leads us to the development of a new type of skills within IT staff.
The more tasks are automated, the more IT professionals become automation supervisors instead of performing those tasks themselves.
That is, while before more specialized staff needed to understand perfectly what the inner workings of each piece of hardware were like, with automation, these people need to be much more aware of how the software works.
They need to understand application programming interfaces and how they can dictate things like policies, rules, and user access.
Conclusions
ITOM and automation together are virtually the panacea for IT professionals.
The secret of a successful transition is to go little by little, in a gradual and logical progression.
Securing tasks, processes, and skill sets so that they move together toward a better future filled with altars in the office for IT professionals!
My name is Sancho and I am the person who started developing Pandora FMS in 2004. I want to tell you why Pandora FMS Open Source exists and why the community is so important to me.
We tell you why Pandora FMS Open Source exists
I always liked computers, I started with a ZX Spectrum and my first game was a hacked one.
I had to teach myself how to peel a cable to plug the RCA video output into my father’s little TV. In fact, I think I’ve spent more time learning how to solder cables, copy games, and trick them than playing them themselves.
In the 80s, technical knowledge was what someone could teach you, there was no Internet. And, as a child, I also didn’t have the resources to talk to expert adults.
When the BBS (Bulletin Board Systems) arrived in Europe I was 14 years old. I still remember, with pristine clarity, the article from a computer magazine that filled my head with wonders:
“Thousands of apps and games, access to information around the globe, messaging with users around the world…”
I could learn anything!
And there were even many softwares that I could use without having to hack them!
When I connected to Fidonet in 1990 a world of possibilities opened up.
I started talking to university students, set up a Fidonet node at home and had the need to do my first programs for my own BBS. It used RemoteAccess and FrontDoor, applications to give access to users and to connect to Fidonet through a modem over the telephone line.
I learned TurboPascal by reading documentation online and with photocopied books in English that other users lent me.
A student at the University of Zaragoza lent me his credentials and I accessed the Internet for the first time through a RAS built on an HP-UX.
I didn’t know what Unix was, but I had some commands written down to download things through FTP and then through Kermit to my computer.
Along the way I had to stick with the AT commands and run head-on with the problem of being a 15-year-old boy who hires two phone lines for a BBS in a room of five square meters.
Thanks to other users I learned how to connect with the pair of tests in the phonebox of my house to call the US for free and download the McAfee antivirus updates, which I made available to everyone.
I later learned how to connect to the internet through Compuserve using trial accounts that lasted 15 days.
In short, I had an insatiable craving for knowledge.
I loved to try, combine and dig.
I used a lot of software that is now forgotten, such as Desqview or OS/2 Warp, to try to make my PC, made with second-hand parts, have the power to work in what became one of the largest BBS in Madrid (Edison BBS).
All the software I developed (online games, time banks and things like that) I shared with other BBS Sysop, although my code was terrible.
*Although no one cared much about the code because everything was to be done and the important thing was that it worked.
Most of the programs I used had to be compiled by other people with more powerful PCs, my machine took days to compile and link the binaries.
Open Source Software Time
When I was in college, the Internet and ADSL came, as well as stacks of photocopied books.
I tried programming video games and then my first job came.
There I discovered that the Internet was a much, much bigger world than I had thought. Where there were servers and networks full of computers that people plugged into the web without notifying anyone, and lots of other stuff that appeared little by little…
That’s when I discovered that it was necessary to bring order to so much chaos.
I needed to know what was happening around me and monitor it.
In each new work, that sense of chaos and lack of control grew.
There did not seem to be a universal system to collect information and unify it, each had its applications, incompatible with the rest. Unlike the world of Star Trek where everything was compatible and universal.
That craving for knowledge and that habit of sharing at that time was not circumscribed to a philosophy, it did not have a name. It was a pure necessity: to share, learn, test, copy and modify.
Some years later I discovered what the term Open Source meant.
But it was just a name, the habit has been in me since I copied my first Game of Spectrum.
*I once met in an interview an English developer older than me who had programmed one of those games, but that’s another story.
I spent many years learning thanks to others.
Now I have to give back everything I have learned since my childhood.
For me Open Source is not a license, it is not a political doctrine, it is not a fashion, it is a way of understanding life.
Sharing knowledge makes us better as individuals, as a society, and as professionals.
That is why Pandora FMS Open Source is not a “limited” version of the Enterprise version, no, the Open Source version has infinite documentation, in several languages, a changing documentation that includes everything, without secrets.
The Open Source version not only has code, it has people who answer questions, guides and tutorials and has no limitations.
It is made for that purpose, to bring order to chaos and allow anyone, programmer or not, to expand and improve it. Without having to share what you do, just let them use it however they want and for whatever they see fit.
There are many users, and companies, that like me when I was younger, cannot afford what an Enterprise license costs.
I encourage them to use the Open Source version of Pandora FMS, not because it is free, but because you can learn without limit and can make Pandora FMS go far beyond what you think.
Moreover, if they want, they can share their knowledge back and improve Pandora FMS.
A code patch has the same value as a collection of icons or a Russian translation.
Where do we get the money?
Easy, not everyone has that craving for knowledge, to learn, to share.
There are people who have their focus on managing problems, quickly and with professional help.
They prefer an out-of-the-box tool that solves problems in hypercomplex and very specific environments.
They still really want to learn and try, but they don’t have the time. Literally, their time is worth much more to their companies than Pandora FMS’s Enterprise license.
Some Pandora FMS tools, such as policies, can be easily implemented using additional tools (or even your own scripts), but it takes time and knowledge.
In the Enterprise version it is solved with a couple of mouse clicks.
The same goes for scalability.
In the Enterprise version we support an active/passive HA system based on MySQL, any user can implement the same system as us, they can also build a Galley cluster to have almost infinite scalability, without the need to mount a Metaconsole (Enterprise).
In fact we have some users who have been using Pandora FMS for many years with much larger environments than most of our Enterprise customers.
I encourage you to see for yourself that the free spirit is still there!
Call it OpenSource, free software, enter the license (GPL2), but above all:
Let’s check out together the features and improvements related to Pandora FMS new release: Pandora FMS 762. Remember that this is an LTS, we only have two of them a year, they are stable.
What’s new in Pandora FMS latest release, Pandora FMS 762
CHANGES AND IMPROVEMENTS
Improved the PostgreSQL plugin to be able to be executed as a server plugin
Enterprise plugin
Through this plugin you may monitor postgreSQL databases through custom queries remotely
A few days ago we gave you the opportunity in social media and through email to choose, by means of a simple survey, the upcoming names of our LTS Release (Long Term Support).
Participation has been a success! More than two hundred participants! Making it clear that you love both our releases and Star Trek of course.
* Let’s not forget that our repertoire of possible names, from which we gave you a choice and vote, was an extensive list of Star Trek spaceships.
Well…
We finally have a winning name for our LTS Release!
Are you ready?
And the winner is… AKIRA.
Our new LTS Release (Long Term Support) will be called Pandora FMS NG LTS Akira.
We already know that with “Akira” you can think of the famous and award-winning manga by Katsuhiro Otomo or his animated film with the same name. At Pandora FMS we love him too!
*Hence our little homage in the above illustration. Give it up for Tetsuo!
But it actually refers to the spaceship Class Akira. A Starfleet heavy cruiser in Star Trek that was specially designed for combat.
3,055,000 tons and a cruising speed of Warp 9.2
As much a boss and as much a geek as we are.
And that’s not all!
Our next LTS Releases will be named after the most voted ships that have followed Akira.
Hope
Renaissance
Andromeda
Defiant
Excelsior
Tachyon
Stellaris
Antares
Apollo
Chimera
It only remains to say that THANK YOU VERY MUCH for your participation and long life and prosperity to all of you!
Your time has come! If you have always wanted to put an epic name to a pet or a child, to your most personal book or album, or for those geek among us to a sword or your faithful steed, here we give you a chance!
Not for any of these things exactly. We’re not so irresponsible that you’ll baptize a poor kid with the alias of your favorite Lord of the Rings character, but we are irresponsible enough for you to vote for the next names of our LTS Release (Long Term Support).
And yes, enough to be a list of Star Trek ships our repertoire of possible names from which you will have to choose and vote.
So let’s go! which one do you stick with?
*Don’t be afraid. The voting system is much more reliable than that of Eurovision. #ChanelNº1
But, of course, as much as you strive to be inclusive when it comes to keeping a close eye on the parts that make up your network, some systems end up escaping your attention.
The so-called blind spots.
But instead of accepting this as an inevitable heavy cross (which, in addition, entails a great cost for your business), consider getting down to work and:
At the very least, avoid what you don’t see from damaging your IT infrastructure and the business processes that depend on it.
Remove the patch! Trace and perfect high visibility
Of course, you might be wondering:
What should a monitoring strategy include?
It is a very frequent question, which requires some zeal and work.
The determination of your monitoring strategy, in favor of greater IT visibility, must begin with creating an outline or index with the relevant information of the systems from all your platforms.
This will make it easier for the individual aspects of each system to be delivered and broken down. You will have before you the parts that interest you, the most appropriate ones, for a deeper evaluation level.
Take this outline, collaborate with the cool IT team of your organization, now actually help to define and implement monitoring with full visibility of all your IT assets.
You can take it as a high school group project!
These renewed aspects to be monitored will include:
Observation of specialized hardware devices.
The cloud-based networks you are using.
Traffic paths across all systems, including hybrid cloud configurations.
That long et cetera that remains to be defined.
And yet, there will still be that possibility that some systems will remain hidden.
It will then be necessary to resort to the use of more comprehensive monitoring tools to help their discovery.
Is perfect monitoring possible?
I’m afraid perfect monitoring coverage is just an illusion.
Even if you have all the award-winning or top-notch monitoring tools at your disposal, it will never be enough to guarantee a coverage of perfect monitoring.
We tell you from experience:
Many monitoring tools create the false illusion of seeing absolutely everything within your infrastructure.
It is so that you have a certain sense of security.
Sometimes it is noticeable when some data packets, which contain sensitive information, disappear from view for a while, appearing, as if by magic, within another system from your network.
Here’s solid proof of a blind spot in your monitoring.
And this test only sheds light on the current capacity of monitoring tools.
So it may sound tempting to get hold of all the monitoring tools on the market so you don’t miss anything, but, come on, this will only lead to a system hypertrophy that will provide you with a false sense of security.
Now what? Is there a technological miracle that escapes us? A definitive monitoring tool that works over good and evil and provides true security and visibility at the height of Sauron’s own igneous eye?
Go further: Machine learning
Clarity is the essence of a successful IT department.
That’s right, security protocols and configurations must be very clear, such as for example, the knowledge of which servers host each application.
It is also more than advisable to find out the status of all the organization’s assets.
Clarity is the root with which to reach, by pulling, the hows and whys of the system’s blind spots.
To achieve this clarity/enlightening you must, of course, have the right tools. Tools with which to perform advanced analysis, with which to cross the different levels and layers of your network.
Your monitoring tool should, at the most fundamental level, bring together the complex layers of monitoring data from the multiple platforms you monitor, as well as employ intuitive levels ofmachine learning to help uncover hidden computing assets.
If you use monitoring tools based on machine learning you reduce the time you spend on executing the root cause analyses, while obtaining a full picture of the IT assets.
Machine learning will also help you eliminate monitoring silos, which, as many of you know, tend to become an burdensome manual task that takes too much time from our precious IT administrators.
Pure and high visibility on a single screen
I’ve scared you very much. But actually, identifying the isolated pieces of technology in your stack and centralizing them for effective monitoring and management is an achievable goal.
Monitoring configurations in a single screen give you an advantage.
Mainly thanks to their capacity to represent data from multiple infrastructure sources and to display them in a single view.
These configurations provide a unique vision of the internal operation of a network and help to identify the misled IT assets that must return to the fold.
With this type of solution, you obtain peace of mind and the capacity to operate effectively in the most complex and accelerated IT environments, while you automate the most concise tasks, for true full monitoring.
Conclusions
Obtaining full visibility of your environment by means of monitoring seems like an impossible task, buuut things can be different!
If you try it at least, you will see in a moment how you obtain higher security levels and higher response capacity in the face of incidents.
But you know, before running the 100 meters you have to learn to walk.
And to end the visibility gap you must do some soul-searching of your systems, identify each point to be monitored, and release the silos, so that comprehensive management and monitoring of your systems is possible.
From here, where else, we advise that if you are truly looking for a solution to get rid of blind spots from your monitoring, take a look at what Pandora FMS can offer you!
As we already explained on one occasion in this blog,Windows Management Instrumentation, WMI, is a technology owned by the company Microsoft®.
But there’s even more!
Things have changed and we are going to tell you all about it!
Do you already know what WMI is and why it will be discontinued?
WMIC was the WMI command-line utility, which provided an interface for the Distributed Component Object Model (DCOM) Remote Protocol.
This protocol, in turn, allows remote procedure calls (RPC) with a set of extensions overlaid on Microsoft Remote Procedure Call Extensions.
DCOM is used for communication between software components such as Pandora FMS and networked devices.
The benefits of monitoring are unavoidable and this type of technology (communication and connection protocols) are used to work, prevent problems and progress.
However, it all depends on the use it is given:
In January 2021, the MITRE corporation registered the CVE-2021-26414 vulnerability, which recognizes that there was a possibility to access the privileges of a normal user, a non-MS Windows® system administrator user.
*Common Vulnerabilities and Exposures is a list of registered U.S. government information about known security vulnerabilities, in which each reference has a CVE-ID identification number.
Never, right at first, an attacker who manages to gain access, stays only as a normal user, no, they usually become system administrators.
Thus, time and commitment are required to study the victim and achieve the task.
The company Microsoft®, concerned about the peace of mind of their customers, decided to publish and distribute the security patch called KB5004442 (February 2022), which increases user authentication.
Therefore, WMIC is not able to connect despite being a product from that same software brand.
However, that’s actually a side effect, not the main reason why the WMIC software was discontinued.
For some time now, Microsoft, progressively, has been updating, deleting and improving each of its components, and has even created new utilities.
This is the case of PowerShell, which will bear the new responsibilities inherited from WMIC from now on.
At Pandora FMS, always respecting our security architecture, we presented PandoraWMIC. Improved software for the new WMI connection requirements, which avoids this type of inconvenience, both in the Open version and in the Enterprise version.
Let’s check out together the features and improvements related to the new Pandora FMS release: Pandora FMS 761.
What’s new in the latest Pandora FMS release, Pandora FMS 761
NEW FEATURES AND IMPROVEMENTS
New “Custom Render” Report
A new item has been included in Pandora FMS reports, Custom Render. With this report you can manage in a more customized way with SQL queries, module graphs and HTML output customization. It allows users to create fully customized reports visually, including graphs.
New TOP-N connections report
A new item has been included in Pandora FMS reports, TOP-N connections. With this report you will have a summary table with the total data from connections and with connections of the interval by port pairs.
New Agent/Module Report
A new item has been included in Pandora FMS reports, Agents/modules status. With this report you will be able to have in a table the state of agents/modules with the last data and the timestamp of this last-received data.
New Agent/Module status Report
It allows users to show a list of agents/modules along with their state, filtering previously by group.
New SLA services Report
A new item has been included in Pandora FMS reports, SLA services. With this report you will be able to see the SLA of the services that you wish to configure, combining data from different nodes in a single report.
New alert templates
If you want to use the new group, you have it available in our module library:
A new view has been added, that of Heatmap. In this view you can see all Pandora FMS information organized by groups and module or agent groups. It is a view that is permanently refreshed and that allows you to see at a glance all the monitored information.
Bring it on Pandora FMS! If we have previously told you about our success at the Open Source Awards 2022 and the Peer Awards 2021, today we are here to tell you that we are at it once again!
We are at the top of G2 of Monitoring Software!
“Why is it easier to get unbiased information about a hotel room than about software?”
In 2012, five entrepreneurs asked themselves this question. The next day, they founded G2.
Una plataforma que en la actualidadA platform that currently has more than 60 million visits per year, and on which users can read and write quality reviews on 100,000 software products and other professional services.
More than 1,500,000 reviews have already been published, which help companies around the world make better decisions about how to reach their full potential.
That is why it is so important and honorable that Pandora FMS has become part of its Top 10 of the best Network Monitoring software.
Ninja One
Atera
Logic Monitor
Auvic
Solar Winds
Domotz
Progress WhatsUp Gold
Pandora FMS
Above many other already recognized companies. Such as Microsoft, Datadog, Zabbix, Nagios, Dynatrace, Catchpoint, Entuity, PRTG, Checkmk, Wireshark, Smokeping, OPManager, Netreo, Munin, Cacti and many more.
A badge that appoints Pandora FMS once again as the total monitoring solution:
Cost-effective, scalable and able to cover most infrastructure deployment options.
Find and solve problems quickly, whether you come from on-premise, multi cloud or a mix of both of them.
In hybrid environments where technologies, management processes and data are intertwined, a flexible tool capable of reaching everywhere and unifying data display is needed to make its management easier.
That’s Pandora FMS
You knew it, and now all G2 users know it too!
How did we get into the Top 10 of the G2 platform?
For now, to be included in the category of Network Monitoring, a product must, among other things:
Constantly monitor the performance of an entire computer network.
Create a baseline for network performance metrics.
Alert administrators if the network crashes, or varies, from the baseline.
Suggest solutions to performance issues when they arise.
Provide network performance data display.
Then comes the usability score of a product, which is calculated using their own algorithm that takes into account the satisfaction ratings of real users.
This rating is also often used by buyers to quickly compare and identify on the page the top-rated products.
The number of reviews received at G2 is also important, buyers rely more on products with more reviews.
Higher number of reviews = Higher representativeness and accuracy of the customer experience
In turn, G2, apart from rating the products based on the reviews collected in its user community, also does so with the aggregated data from online sources and social networks.
And then, participate in the different categories where you can earn badges like the ones we have won:
Best Usability.
Easiest to Use.
Easiest Admin.
Best Meets Requirements.
And as they say over there:
That would be it!
Today we have reached this milestone, and since 2020 we have been winning these categories, all seasons! Let the Himalaya tremble in fear, we continue climbing to the very top!
If the spreadsheet was the essential application for accounting and massification of personal computers, MS Windows® operating system was the graphical interface that turned work into something more pleasant and paved the way for web browsers for the Internet as we know it today.
Decades ae gone by but there is always a joke, among us computer scientists, that prevails in time:
“This is the year of Linux on our desktops”.
I actually think that, in the end, it is a statement that comes with a flaw from the very beginning:
The kernel (Linux in this case) has little to do with the graphical interface, the actual thing is that the applications that go along with Linux, such as GNU/Linux, are the combinations that should take their place in hundreds of millions of computers in our homes and jobs.
The MS Windows® operating system (OS), despite losing ground with Android/Linux on our mobile phones, still has it still going on on desktop computers and in the field of video games it keeps its position, faring pretty well.
Many say that desktop personal computers will disappear. I personally think that we will connect the monitor, keyboard and mouse to our cell phones at home and at the office.
But today MS Windows has a stronghold in its market position and for Pandora FMS it has implied a series of very special considerations for its monitoring.
The overview
Monitoring with Pandora FMS can be done both remotely and locally and the MS Windows® OS is no exception. Remote monitoring can be performed through SNMP and through WMI.
*If you are new to monitoring, I recommend you to take a few minutes to learn about Pandora FMS Basics.
For local monitoring install a small program, which is called Pandora FMS Software Agent.
Once installed in MS Windows®, the modules to collect the most relevant information (disk usage, RAM consumption, etc.) will already be installed by default.
If what you need to monitor is the basics of MS Windows® the Open version of Pandora FMS is more than enough for the task.
Windows® event monitoring
The amount of applications for MS Windows® is humongous but in a way it is easy to monitor applications and even processes, since we have a special instruction for the Software Agent called module_Proc.
This instruction is able to tell us, either immediately or every certain period of time whether a program or process is running.
So far all this is the basics for monitoring MS Windows®.
And in the case of Pandora FMS Enterprise version you can “transfer” normal events to events in Pandora FMS, which can generate alerts and warnings for us to take the necessary actions, or let Pandora FMS restart the software vital to our work or business.
* The latter is known as Watchdog: if an application for any reason stops in MS Windows®, it is re-launched and executed.
Analyzing the causes
Simplifying as much as possible: So far we can say that we are working on true and false, on ones and zeros.
But often it is called on to us to analyze under what conditions an application collapses or find out why it does not start.
If all that related information had to be seen on your screen you simply would not be able to work with so many interruptions. For that reason there are event registries and working with them implies more specialization on Pandora FMS behalf.
MS Windows® presents an advantage as a privative software for its monitoring and it is that its events and corresponding logs are centralized after a certain routine or standard way.
Monitoring an individual event
Pandora FMS offers the instruction module_logevent that uses Windows® API and offers better performance than data collection by means of WMI.
You will obtain data from the event logs from Windows itself.
Along with additional instructions, it offers the ability to monitor very specific events identified by the fields Log Name, Source, Event ID and Level.
Remember I told you they’re standardized?
Well, in Log name they are well defined by:
Application.
Security.
Installation.
System.
Forwarded events.
And you must use one of them for the instruction module_source, which is mandatory in the module to be created in Pandora FMS Software Agent.
Up to this point we have only discussed simple modules of Pandora FMS agents but, depending on your needs all the above can also be done as a complement or Pandora FMS plugin.
The difference is to place module_type async_string when it is a data module and module_type log when it is a plugin.
Plugins offer flexibility as they can return multiple data at the same time, unlike Pandora FMS modules that only return a specific, normalized data type in Pandora FMS.
This is important for what we will see below: The instruction module_regexp which has as a parameter an event log file (.log) on which you will search for keywords with the instruction module_pattern.
This is necessary because there are old applications that keep their own separate event log, although in other regards they do not escape the Windows log.
En MS Windows® algunos log que no están en el registro de eventos del propio Windows, pueden ser recogidos mediante los canales de registros de eventos (Windows Event Log channel o simplemente log channels) con una instrucción especial lla
In MS Windows®, some logs that are not in Windows event log can be collected using the Windows event log channels with a special instruction called module_logchannel that does not carry any parameters but then uses module_source<channel_name> together with module_eventtype (event type), module_eventcode (event code) and even module_pattern to search by keyword.
However, I said that we are looking for or investigating the cause of some problem or inconvenience in an application that runs on MS Windows®, but the examples I have given are specific and go directly to monitor a particular point.
Alright so…
How do we do it if we don’t know exactly what we’re looking for?
Elasticsearch and log mass collection
What I needed to explain is that if you use a plugin to collect logs you must install, together with Pandora FMS, a powerful tool called Elasticsearch.
Which uses a non-relational database capable of storing and classifying all this large amount of information.
But don’t think Pandora FMS just delegates the work, no:
From Elasticsearch you may go back to Pandora FMS to generate alerts and reports that you scheme and then create in Pandora FMS to finally understand what the conditions and precise values are when an application fails (or has peak workload values, or is “doing nothing”, etc.).
Conclusions
He resI have summed it up as much as possible and I recommend that you watch the tutorials over and over again until you fully understand and are able to put it into practice installing both Pandora FMS and Elasticsearch. If you have any problems, check the official documentation, which is extensive on the topic “Log monitoring and collection.”
I have been a regular user of Pandora FMS for years and the best I can say about them is that they always have something new to add to my learning. Today, for example, I rediscovered the Two-Factor authentication in Pandora FMS!
*And I did it, in part, throughthis articlealready published on their blog
Although I devote myself to programming (and it is what I like to do the most), I am more of a Web 2.0 person than a Web 3.0 person because I consider that the latter has been abused too much.
In 2.0, communication is bidirectional and at the same level, while in 3.0, when one inquires something they answer:
“And who’s asking?”
Having already taken advantage, of course, of unnoticeably checking our geolocation by means of your IP address.
No contentos con eso, en fin, nos pegan unNot happy with that, anyway, they stick a label on us as if we were digital livestock…
*And no, I’m not paranoid,several countries globallyare amending their national privacy laws! (That’s why I mainly use the DuckDuckGo search engine).
But I wouldn’t ever go back to stay on the Web 1.0; at that time, the 1970s and 1980s (my youth), we were too innocent.
*For example, for many years the password to launch American mass destruction weapons was simplyzero repeated eight times…
Obviously we need more robust authentication systems. And one of them came, not from a programmer but from a far-sighted entrepreneur, Kenneth P. Weiss.
Their input was essential to the world and to the issue we are discussing here today.
Since talking about encryption and security gives us enough material to write a whole book, let’s dive into it then!
Get to know the Two-Factor authentication in Pandora FMS
It is important to distinguish what is a Two-Factor authentication and two-step authentication.
Many banks force us to add several security questions that they use after entering our password. They randomly choose one or more of them and we must respond. The point is that they’re always things we know.
A second authentication factor is more about “what you have’‘.
There’s Mr. Weiss’s genius. How to authenticate that “something we have”?
However, Two-Factor authentication technology has evolved and now it also includes, quite frequently, biometric identifications. That’s basically, “what you are”.
My mobile phone, for example, includes fingerprint reading. But it would also be worth an infrared-based facial identification to detect by heat the veins and arteries of our face.
*Not even identical twins in the same egg have equal blood distribution.
More recently, another category has been added: what you do.
The way you sing or make a gesture. Even the speed of your typing, pauses included, and much more.
En todos eIn all these cases it is an additional security layer. To be considered as a Two-Factor authentication, at least two of them must be used.
The acronym MFA is used when three or four of the aforementioned methods are used.
Finally, it is important to point out the case of hardware devices as a second authentication factor: YubiKeyor the trendy Trusted Platform Module version 2.0 (TPM 2.0).
Operating mechanism
Like I said, it’s all about the private and public key pair.
In short, a private key is generated, which is shared with us users and when the time comes to use it, the date and time are taken and a public key is calculated.
That key is only valid for a period of time, say a minute, and it will be the one we give to identify ourselves.
In the site where we are going to enter, where said private key was generated, the same is done, the public key is calculated also for that period of time and is compared with the one that was delivered to the user atthat moment.
Of course, this is much more complex than what I am describing, but as Leonardo da Vinci rightly said: “Simplicity is the ultimate sophistication.”
Pandora FMS and Google Authenticator
At Pandora FMS, Google Authenticator has been chosen, which is not surprising, because this company Alphabet Inc. has been in our lives for more than twenty years already and has become “the elephant in the room”.
Of course, there are also many others like LastPass Authenticatoror Microsoft Authenticator.
Two-Factor authentication is not a strong password backup itself. We must use strong passwords so that we have a time period of at least one month (and we should change them monthly).
*If there is a leak of the hashof our password, as it is robust, the thieves will take more than a month to decipher it and before that happens we will have already changed it ourselves.
• Both authenticators I tried can work offline without any problem because they depend on the time and date as I explained.
*However, if any unlikely problem occurs with the time and date on our mobile, Google Authenticator has the option to synchronize online without affecting the time and date of the device at all.
• But not everything was going to be good news: I also print backup codes that I store in a safe place for gmail emails.
*To download Google Authenticator, they will ask to implement the second authentication factor for mail.
Once you wish to log in to a new device, you may use the “Try other methods” option and enter one of the 8-digit backup codes. Remember to cross this code out of the list because they can only be used once.
• From your user profile in Pandora FMS, right next to the button to deactivate the second authentication factor, there is the “Show information” button, which will allow you to show the private code again to add it to an additional backup device.
*Let’s say that the battery of your main mobile has been completely discharged: you save time to enter Pandora FMS with the backup device.
• Time is precisely one of the most frequent complaints in the use of the second authentication factor, since it takes longer to enter.
*But, calm down, I’ll say goodbye with the comforting fact you expected:
80% of attempts to force our accounts can be avoided with the use of a second authentication factor!
The history of this blog explaining what is what in the world of technology is long, we admit. Maybe one day we’ll release a compilation episode, sort of a cabaret musical thing, with all the info and even some special guests, why not! Meanwhile we also tell you what Active Directory is.
Do you already know what Active Directory is? We’ll tell you!
Both the LAN networks in general and Active Directory particularly, in a world as interconnected as this, are essential.
Private corporations, public institutions, private users like you… We all want to connect our computers and get the best Internet access we possibly can. And for this there is nothing like Active Directory. We ourselves use it!
Active Directory (AD or Active Directory) is a very useful tool (by Microsoft) that gives us directory services on a LAN.
Among its many virtues, we find that it provides us with a service, located on one or more servers, with the possibility of creating objects such as users, computers or groups to manage credentials.
A su vez nos ayuda a administrar las políticas de toda la red In turn, it helps us manage the policies of the entire network on which the server is located.
(User access management, customized mailboxes…)
Active Directory is a tool designed and redesigned by Microsoft for the working environment. That is, it works better in the professional field with great computer experts and ample technological resources.
(To manage multiple equipment, updates, installations of new and complex programs, centralized files, remote work …)
However, how does it work?
Ya We already know what it is, but how does Active Directory work?
The first we need to know are the network protocols that Active Directory uses:
LDAP.
DHCP.
KERBEROS.
DNS.
The second? Well, roughly, we will have before us some kind of database.A database where the information of the authentication credentials of the users of a network will be stored, in real time!
That way you will have all the teams joined together under a central element.
If you enter the Active Directory server, you’ll find a user made up by the common fields (Name, Surname, Email…).
This user corresponds to a specific group, which has certain advantages.
When users try to login, they will find a lock screen, and that will be the time to enter their credentials. On the other hand, the client will request the credentials from the Active Directory server, where they have been entered by the user, to be verified. That’s whenthe user will be able to log in normally and will have access to the files and resources that are allowed.
Hay al menos una cosa buena de todo esto, y esa es que si el There is at least one good thing about all of this, and that is that if the computer where you are working breaks down, because of the classic overturned coffee or the confusing lightning that comes through the window and attacks your PC, with Active Directory, all you would have to do is change to another computer connected to the network. Away, of course, from any window or unstable coffee.
Conclusions
Active Directory is an active directory created by Microsoft as a directory service on a distributed computer network. It uses several protocols.
These include LDAP, DNS, DHCP, and Kerberos.
Es un servicio establecido enIt is a service established on one or more servers, where you may create users, computers or groups, in order to manage logins on computers connected to the network. Also the administration of policies throughout the network.
Remote network moniRemote network monitoring is a technical specialty that was born almost at the same time as networks themselves. Since then, many strategies have emerged when it comes to monitoring network elements.
In this article we will talk about the current techniques based on SNMP polling and network statistic collection through Netflow, and we will also mention outdated systems such as RMON.
Most techniques are purpose-oriented, so they are especially useful. Some more modern ones use combined techniques to offer greater control and knowledge of the network.
Remote network monitoring consists of detecting and being aware of the status of any device connected to the network.
It can be network-specific hardware (such as a router, server, printer) or a specialized device (such as a probe or IoT element).
Simple, right?
Then let’s talk about the different techniques you have to monitor a network remotely.
Basic network remote monitoring techniques
Often this monitoring takes place through basic techniques.
With basic techniques we mean something as well known as pinging and checking whether the computer responds to the network.
What is pinging? It is a communication mechanism that allows you to find out whether a computer is connected and responds when you “knock” on its door.
To use it you just have to know its IP address.
Other basic techniques include measuring latency times, network lagging, or network packet loss.
The most common and already much more network-specific techniques include the use of the SNMP (Simple Network Monitoring Protocol) protocol for obtaining specific information from devices connected to the network: number of connections, incoming traffic through its network interface, firmware version, CPU temperature, etc.
Something that, if we use technical language, is known as SNMP polling.
Other tools use protocols from the Netflow family (JFlow, SFlow, Netflow) to obtain statistical information about network usage.
This statistical information is incredibly useful to be able to analyze the use of the network, detect bottlenecks and, above all, to have a clear vision of what the communication flows between the different elements of a network are.
There is an almost obsolete protocol called RMON. However, it is worth mentioning, because we can still find it in some installations.
This protocol used a network monitoring technology that listened to the wire to obtain statistical information using a specific SNMP agent. Something like what Netflow does.
On the other hand, most devices still use SNMP TRAPS to report incidents in asynchronous mode.
Although it is a very old method, it is still used today as a monitoring method on almost all network devices.
Not to be mistaken with the SNMP Polling that we discussed at the beginning!
If you are interested in remote network monitoring, we have something to tell you
Pandora FMS is an Open Source software that has the same features of its paid version. You can monitor whatever you want, for as long as you want, for free!
Sounds good?
Sign up and we’ll tell you how to get Pandora FMS Open version:
Advantages of remote network monitoring
The most important and simple advantage is to find out the status of the network:
Whether it is active
Whether it is overloaded
Which devices have the most traffic
What kind of traffic is circulating over the network
Bottlenecks
Jams
…
An example of a traffic flow diagram captured with Pandora FMS could be the following:
Remote network monitoring tools
Most network management and monitoring tools automatically detect connected systems and draw a network map representing the network.
The most advanced tools allow you to update that map in real time and see even the physical connections between interfaces (known as a link-level topology or Layer 2).
For example, like this automatic network map generated with Pandora FMS:
Remote monitoring in network management
Some systems incorporate what is known as IPAM (IP Address Management) and, at the same time, monitor network status, allowing IP addressing to be mapped and controlled so that you know which networks are free and how they are used.
How does a network remote monitoring tool work?
Generally, a tool like this one has a central server that allows you to detect systems and launch network tests (ping, icmp, snmp) to find out the status of each device.
To know the network in detail through its network flows in real time, you will need to configure the network routers and switches with the Netflow protocol and send that information to a Netflow collector. Although only professional medium/top-range network equipment supports the use of Netflow.
If you use an advanced monitoring tool, it will have its own Netflow collector.
Sometimes it is necessary to monitor devices that are in inaccessible networks, so intermediate polling servers, called proxies or satellites, are used.
These secondary servers perform network scans and monitor the devices nearby, and then send the collected data to a central system.
But what do we do with all these numerical data?
It is essential for the monitoring tool you use to have graphs, reports and visual screens to display those data.
If we dive into top-of-the-range tools, those visual network maps will allow you to manually correct and add the details you need to manage those networks.
What is the best remote network monitoring software?
The professional tools that cover SNMP, Netflow, network maps and IPAM that work best today are:
SolarWinds
Whatsup Gold
Pandora FMS
Although they differ from each other in several respects, you may cover all your monitoring needs with any of them.
Would you like to learn more about remote network monitoring tools? Then this will no doubt interest you!:
Some only support basic SNMP, but do not support Netflow. Others do not offer good discovery or map editing capabilities and most of them do not have IPAM features either.
The basic features a good network monitoring tool should have are:
We already live in a post-apocalyptic future that has nothing to envy to great franchises like Mad Max or Blade Runner.
Proof of this are pollution, pandemics and the fact that your most intimate secrets can be violated because your most impenetrable slogans are in a database of leaked passwords.
Do you feel that pinch? It’s fear and cruel reality knocking at your door at the same time.
But, well, let’s stand by. Just as Mel Gibson or Harrison Ford would do in their sci-fi plots. Let a hard guy grimace get drawn on your face, adjust your pistol grip and put on comfortable shoes. Help us and help yourself answer this question:
Are you in a database of leaked passwords?
You already know that periodically, the security of large companies that store hundreds of data, including your passwords, is violated with total impunity.
That is why we will try to guide you to check, in a simple way, whether you and your passwords are in a database of leaked passwords.
That way you will find out whether you are safe or you already have to start thinking about coming up with new and original passwords.
*Remember:
No matter how far-fetched and armored it may seem, from time to time you will have to check if it has been leaked. We do not want anyone with bad intentions to use them and take advantage of some of the services you have hired or, directly, steal your information.
To guide you in this search what we will do is start by checking your emails. We will check whether they are included in some of these databases of leaked passwords. That way we will not only reveal if these have been filtered, but also the rest of the accounts in which you repeat the same username and password over and over again.
Is all this necessary?
Between you and me, it’s easier to memorize a password than to try it with hundreds. That’s why you repeat the same one since your teenage days! Damn it… maybe even since you met messenger and Terra chat.
But this is a very dangerous thing! If someone has already obtained your old hotmail email and the password you used in it, and that you may continue to use, what they will do is, apart from appropriating your email, is to use that information to enter other platforms or services where you continue to use the same username and password as in that hotmail.
Once you know whether any of the credentials that you usually repeat have been leaked, you will have in your hand the option to change them both on the site that has been violated and in the rest of the places where you use them.
How do we do it?
To find out whether the passwords of any of the websites in which you have registered have been violated and filtered, you just have to go to:
Go to the main text box. In there type the email account you want to verify. You will be immediately shown the accounts or platforms, linked to it, that have been breached.
If after typing your email and pressing enter, the screen turns green, you are in luck, your email has not been involved in any massive leak.
However, if the screen turns to a maroon shade… Shit! The password linked to that email has been leaked! What’s more, the very attentive page will tell you where. Below you will see a list of websites where you used to enter with that email and where the passwords have been stolen.
Go change passwords! Both from your email and from all the pages that appeared to you. Well, and the rest where you may be using the same username and password that you used with the compromised accounts.
Conclusions
We know it’s a hassle to change passwords every once in a while, but so is it to have your account stolen and impersonate you by putting a horrible profile picture. This among many other unmentionable bad deeds that can be done. Now that you can check whether you’re in one of those leaked password databases, we leave it to you.


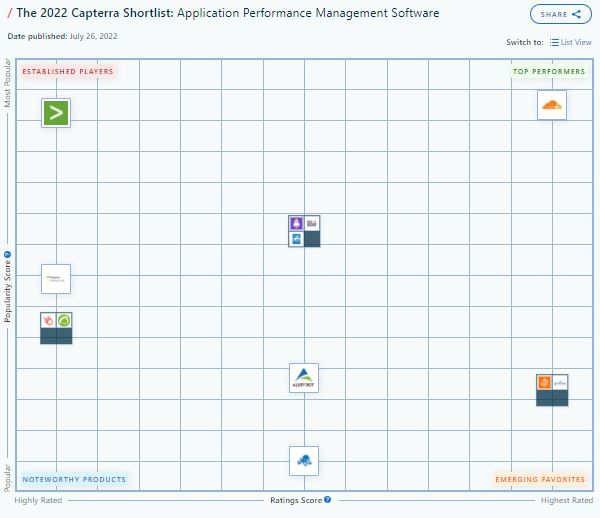


 para Satellite Server")