


SNMP protocol, whose first version was officially released on 1990 and means Simple Network Management Protocol, is the easiest and simplest way a sysadmin has in order to manage and diagnose problems inside his network devices.
Let’s see what is, how snmp works and why this simple protocol is the essential key for a smooth network environment.
What is SNMP?
In the most general terms, network monitoring means the use of available communication protocols to collect information on the status of communication systems, whether they be routers, land line communications or cell phones. Among them, SNMP raises as the most used monitoring tool.
As we previously said, SNMP works as a mechanism of communication between network devices and a network administrator. Routers, switches, servers, printers…, most of every and each network device supports SNMP protocol. Not only with informative purposes, but also to perform different actions inside those devices (such as remote configuration).
How does SNMP work?
Belonging to the application layer (7th layer of the OSI model), allows communication between network devices. Those known as SNMP agents (request receivers) work in a set of predefined UDP ports, known as SNMP port or SNMP ports. Request receiving port (sent by any available port) is UDP 161 and UDP 162 is used to receive notifications (also known as SNMP trap port).
SNMP protocol works in two different ways: SNMP polls and traps. Polling consists of launching remote queries, either actively or on demand, carrying out operation queries synchronously. Traps, meanwhile, are messages sent by SNMP devices asynchronously, according to changes or events, to configured addresses.
To get the most out of SNMP monitoring, it’s best to use both modes when setting up a monitoring system.
SNMP versions
SNMP currently has three different protocol versions, gathered in different RFCs over time (since first ones on 1988, until today).
Those versions are:
- SNMPv1 – defined in RFC 1155, 1156 and 1157, defines the way SNMP works.
- SNMPv2 – communication and security improvements of first version. It has two subversions, one on which security is community based (version SNMP2c, RFCs 1901 and 1908), and one on which security is user based (version SNMPv2u, RFCs 1909 and 1910).
- SNMPv3 – this third version, which includes and improves security and encryption, has struggled to find a market. The SNMP v3 is defined in RFC 3411 and 3418 and, since 2004, SNMPv3 is known as the actual standard protocol version.
SNMP alerts
Therefore, after knowing how SNMP protocol works, it is clear that one of its main uses are the alerts generated by all devices. Two types can be found in a SNMP monitoring network: synchronous alerts, those requested by an agent SNMP request (known as SNMP polling alerts), and asynchronous alerts, without agent request (known as SNMP traps or snmtraps).
This alert and notification system is the true key of SNMP protocol used in network monitoring tools base their operation of custom alerts. For example, in Pandora FMS we handle a wide range of custom alerts that can be triggered based on these SNMP alerts.
Now lets discuss in more detail what are and how monitoring works based on SNMP polling and SNMP traps.
SNMP trap monitoring
First configure your devices to send traps when specific circumstances are met, and secondly set up a tool that can collect the SNMP traps it receives, whether it be a machine with the necessary services, or a piece of monitoring software. How you configure the SNMP devices will depend on the manufacturer’s model and the device itself, and is carried out from a management interface accesible via a browser and its IP address.
Traps can be received in Linux by using the demon snmptrapd, installed as follows, e.g. on CentOS systems:
# yum install net-snmp-utils net-snmp-libs net-snmp
In our example we’re going to use Pandora FMS to receive and process the SNMP traps. If you already have a Pandora FMS server installed you won’t need any new dependencies, but you’ll have to enable it to receive the traps. Search for snmpconsole in the pandora_server.conf file and enable it as follows:
snmpconsole 1
Once the SNMP traps console is enabled Pandora FMS will be able to receive and process them and display them in the corresponding section:
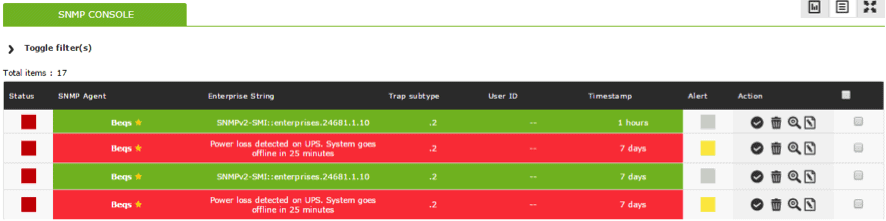
To ensure the incoming traps are arriving correctly, you can consult the corresponding log file, usually at: /var/log/snmptrapd.log.
SNMP trap alerts
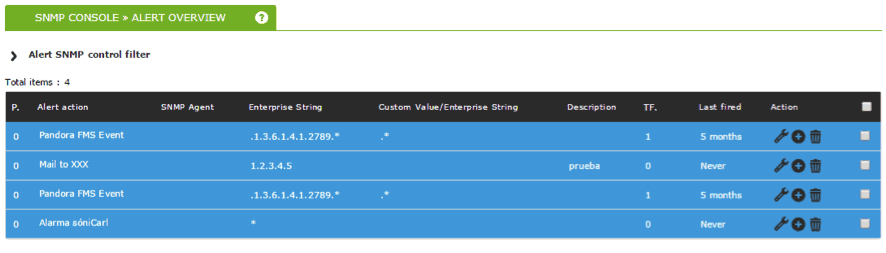
Alerts can also be configured via SNMP monitoring for the traps we prepared. In this case they won’t function in the same way as any other module, unlike with SNMP polling, but instead are based on filtering rules. Using these rules we can identify traps belonging to other devices, filter the contents of said trap, OID, etc..
In the next screenshot you can see various alerts created with different filtering options, and actions checking that everything is working fine:
SNMP polling monitoring
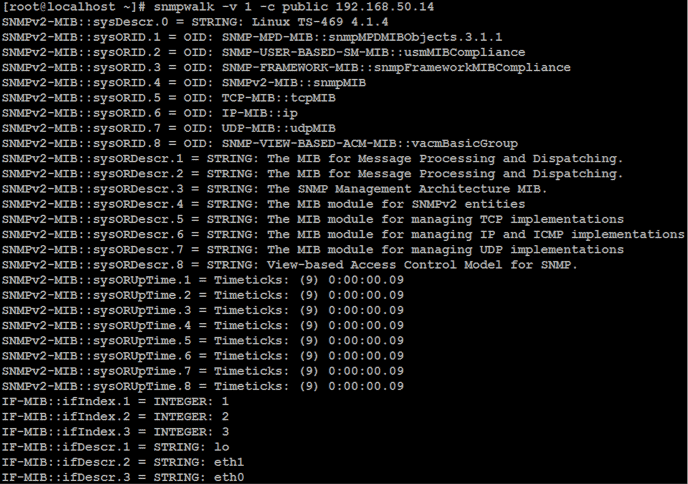
The protocol works by launching a query against an IP address and requires a specific parameter: the SNMP community string, an alphanumeric chain used to authorize the operation, and which adds an extra layer of security. When an SNMP check is launched against a compatible device, you get a list containing a lot of data that can be difficult to interpret at first:
# snmpwalk –v 1 –c public 192.168.50.14

Each line returned by snmpwalk has an OID (object identifier) and corresponds to a piece of data determined by the device. To better understand what the values returned by the SNMP check are, you can install the system manufacturer’s MIBs (management information base). MIBs are libraries that translate these numeric chains into a legible format allowing us to interpret the data.
Let’s look at some data we’ve got back after executing an SNMP check with the MIBs installed:
There are also web sites where you can consult any of these OIDs in case of doubt. If you know the OIDs you want to monitor, you can carry out the query like this by indicating the alphanumeric code that appears after the IP address in question:
# snmpwalk –v 1 –c public 192.168.1.50 IF-MIB::ifPhysAddress.2

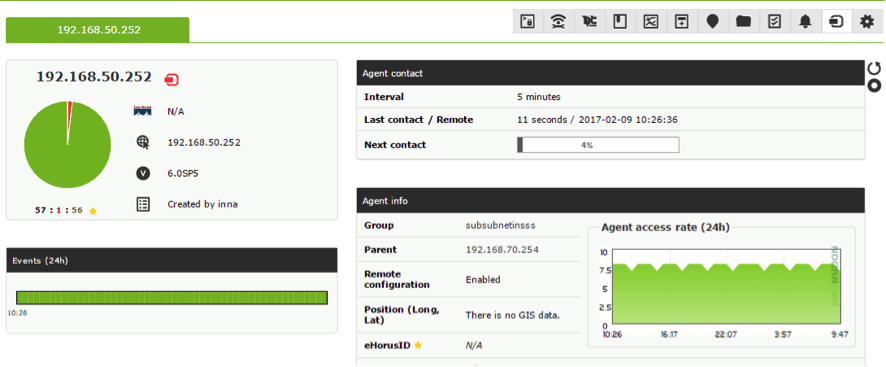
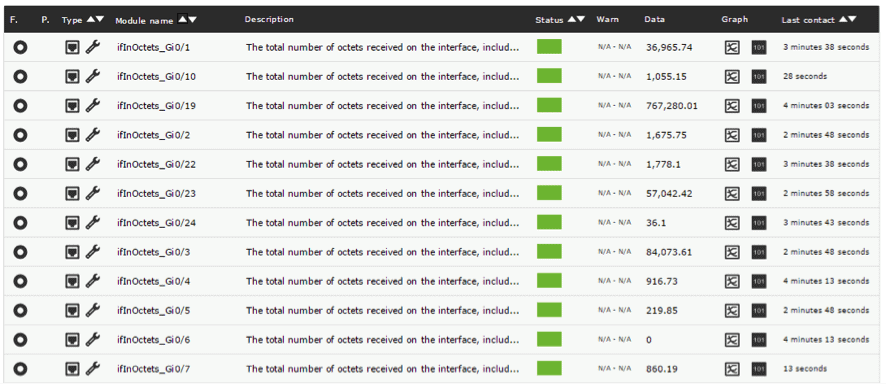
Done like this, only the values of the SNMP object queried will be shown, so if you have a monitoring tool the data will be included in the different checks. In this case, we created a basic SNMP monitoring for a few devices using Pandora FMS, and the result is as follows:
SNMP polling alerts
Once data collection on modules via SNMP polling is being carried out, we can create alerts on Pandora FMS for those modules, executing actions proactively in function of the thresholds we’ve configured, and they work in the same way as any other alerts for any modules on Pandora FMS.
SNMP modules in Pandora FMS
We built Pandora FMS as a flexible monitoring software, capable of monitoring devices, infrastructures, applications, services and business processes. Among them, we have a complete SNMP module.
If you want to know what Pandora FMS can offer, you can discover it here.
Or if you have to monitor more than 100 devices you can also enjoy a 30 days FREE DEMO of Pandora FMS Enterprise. Get it here.
The Pandora FMS team will be very happy to help you!
Pandora FMS’s editorial team is made up of a group of writers and IT professionals with one thing in common: their passion for computer system monitoring. Pandora FMS’s editorial team is made up of a group of writers and IT professionals with one thing in common: their passion for computer system monitoring.


