


What is Grafana?
Grafana is a tool made in free software, specifically with Apache 2.0 license, devised by Torkel Ödegaard (who is still in charge of its development and maintenance) and created in January 2014. This Swedish developer began his career in the .NET environment and in 2012 (to date) continues to offer development and consulting services on this popular proprietary platform, in parallel with the development of open source software. Grafana is written in Go Language (created by Google) and Node.js LTS and with a strong Application Programming Interface (API). It is an application that has been climbing positions, with an enthusiastic community of more than 600 well integrated contributors (there are 7 lead developers -Torkel at the head- and 5 part-time to coordinate such a group of people). Its source code is published, of course, on GitHub.What does Grafana do?
Grafana is a tool for visualizing time series data. From a series of collected data we obtain a graphical overview of the situation of a company or organization. From words to deeds: Wikidata, the huge knowledge database, collaboratively edited and progressively structuring the articles in the online encyclopedia Wikipedia, uses grafana.wikimedia.org in a public way to show the edits made (in our personal case we do it regularly) by the collaborators – and machines – with the “pages” created (or rather, data sheets created) and edited in a certain period of time: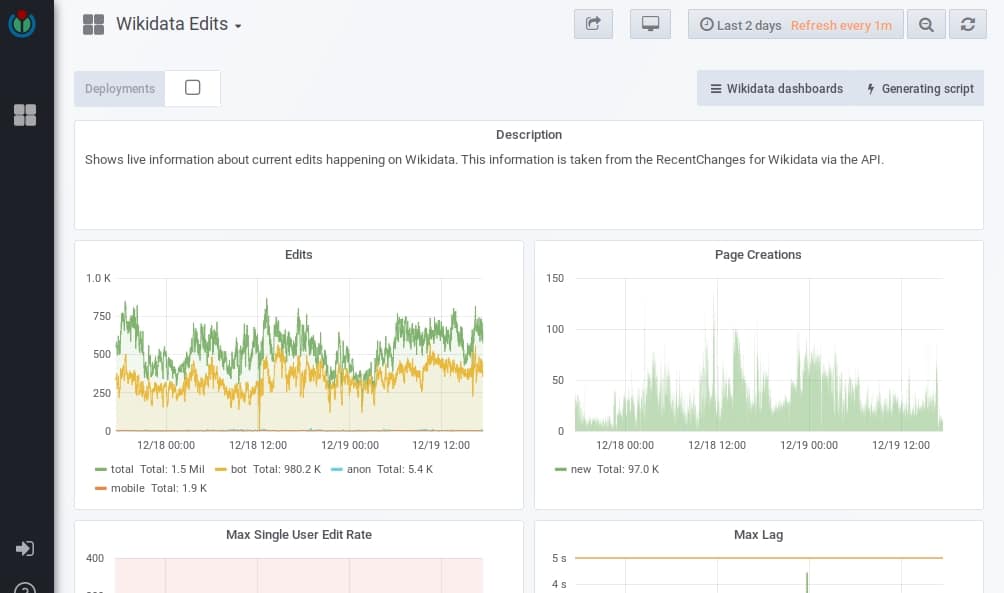
What is Grafana for Wikipedia and/or Wikidata?
It is just a way to represent statistical data in a fast and public way, always using open source and/or free software. Other entities that use Grafana regularly are:- European Organization for Nuclear Research (CERN).
- DigitalOcean, a hosting service for virtual machines based entirely on free software.
- Fermi National Laboratory (FermiLab).
- And many other private companies!
What are the advantages of Grafana?
What makes Grafana special? What makes it unique?
It can run in TV mode (a particular euphemism for kiosk mode) so that, every certain preset time, it can display different control panels that we have saved in playlists. This seeks to solve two details: if we cannot visualize everything at once on one screen, then divide it into parts and display it automatically and periodically; the other detail is to combat the static, for us human beings, of seeing the same screen – with values that change, of course – but that attracts our attention – and that of the public, as the case may be – by making the graphical transition. To exit the kiosk mode we only need to press the “d” plus “k” keys, which brings us to the next point. Grafana loves the use of the keyboard. What is Grafana without a keyboard shortcut? It’s like a flower without a scent, poetically speaking; for developers this is a point of honor: being able to work without the use of a pointing device such as a mouse. Again, in our personal case, we value this feature very much, not only in this software but in any other. If we want to see online a demo, in this web link you can see something like this: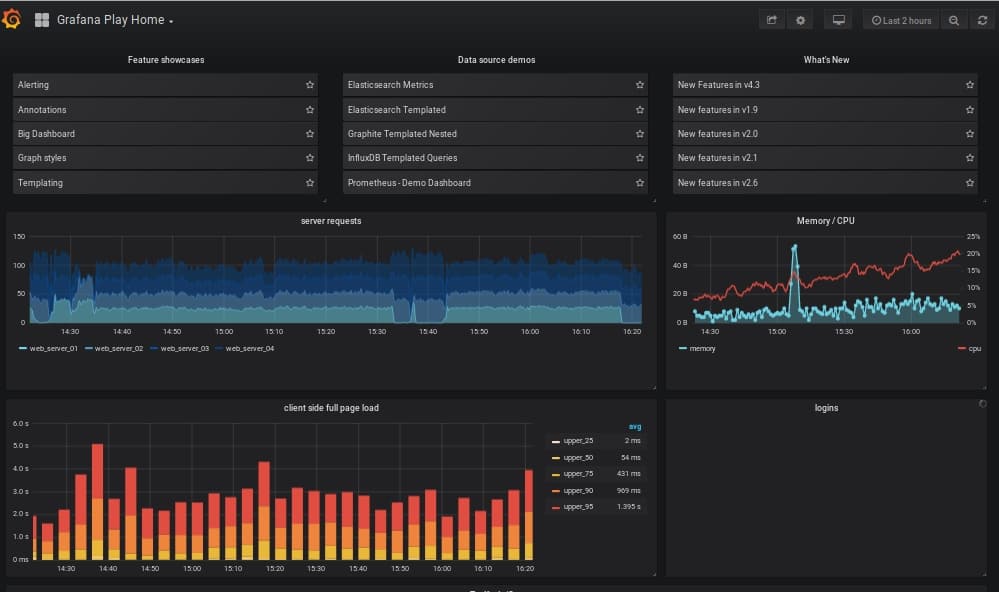
Grafana Ecosystem
As we said, it serves to visualize information, which is collected and/or processed by third party applications. The sole purpose of Grafana is to present monitoring data in a more user-friendly and pleasant way. At this point we should make a disclaimer: it can natively collect data from Cloudwatch, Graphite, Elasticsearch, OpenTSDB, Prometheus, Hosted Metrics and InfluxDB. There is an Enterprise version (grafana.com) that uses add-ins for more data sources, but there is no reason why those other data source add-ins cannot be created as open source, as the Grafana add-in ecosystem already offers many other data sources; as of February 2018:- 37 data source add-ons.
- 28 dashboard add-ons.
- 15 application add-ons.
- Over 600 dashboards created for popular applications.
Grafana in the monitoring field
Elasticsearch is one of the data sources for which Grafana offers native support; this is not surprising, considering that Grafana was initially a component within Kibana, from which it was forked. The ELK platform means the combination of Elasticsearch, Logstash and Kibana; the first two components are used by Pandora FMS since version 712 for log collection and we show it summarized in the following image, which is worth more than a thousand words: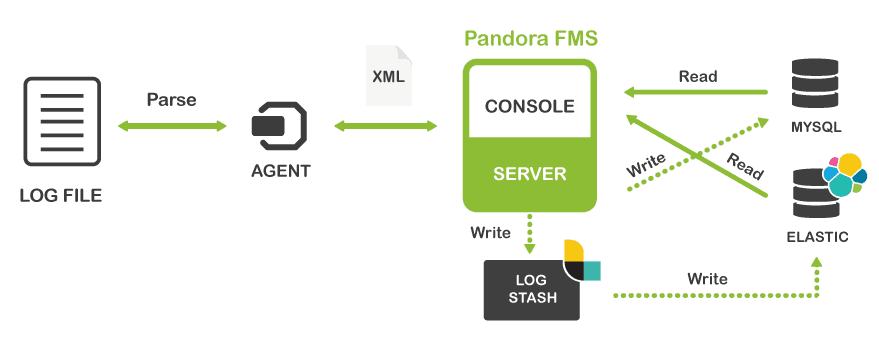 Note: Pandora FMS has a powerful web console and Metaconsole to unify them; it can run in kiosk mode and provides powerful tools associated with monitoring as a whole.
This article about Grafana is just a sample of the extraordinary flexibility of Pandora FMS, and does not signify a public endorsement of the information presented here.
Note: Pandora FMS has a powerful web console and Metaconsole to unify them; it can run in kiosk mode and provides powerful tools associated with monitoring as a whole.
This article about Grafana is just a sample of the extraordinary flexibility of Pandora FMS, and does not signify a public endorsement of the information presented here.
If you want to see it for yourself totally free and for any size of installation
Sign up here and we will tell you how:
Time is an important factor when searching and viewing logs. The keyword(s) will be the other determining factor, but who provides this keyword? For this we imagine non-routine scenarios: one or more executives who have at their disposal a programmer who builds the necessary dashboards to represent the most varied information, or perhaps a network administrator who wants to take the information of a certain development that is being applied to a production system. Actually, there are many uses that we can give to Grafana, besides the fact that it offers a user authentication at user level that could be shared with Pandora FMS if used in both LDAP. However, we find more useful the possibility that Grafana connects by authentication with GitHub so that our programmers can themselves look up their own log information without affecting the system(s) to which it is connected. What is Grafana for programmers? It is the opportunity to investigate – and review – the result, in production – of their own applications, with no more effort than creating the necessary dashboards and/or customized dashboards!
Pandora FMS always at the forefront
You can have your own style of programming, working and doing things, either in the old way or as we need in our development team, but you always have to keep updated with the advances and new trends, which as we see can become new useful tools. If you want to try them all at zero cost, sign up here and we will tell you how:
Programmer since 1993 at KS7000.net.ve (since 2014 free software solutions for commercial pharmacies in Venezuela). He writes regularly for Pandora FMS and offers advice on the forum . He is also an enthusiastic contributor to Wikipedia and Wikidata. He crushes iron in gyms and when he can, he also exercises cycling. Science fiction fan. Programmer since 1993 in KS7000.net.ve (since 2014 free software solutions for commercial pharmacies in Venezuela). He writes regularly for Pandora FMS and offers advice in the forum. Also an enthusiastic contributor to Wikipedia and Wikidata. He crusher of irons in gyms and when he can he exercises in cycling as well. Science fiction fan.


