


Web server monitoring
This article aims to present some of the options for web server monitoring that you can perform with Pandora FMS. We’ve taken an Apache web server as our example, and we’re going to focus on four key points:
1. Monitoring the Apache server-status, which provides useful metrics on the status of your web server.
2. Monitoring tcp connections with netstat. They can be filtered by ESTABLISHED, TIME_WAIT, LISTEN or by specific IP addresses.
3. Monitoring the access_log to get specific data about orders, such as, number of orders, their origin, etc.
4. Monitoring your website externally: is my page up? What is its response time? Are there any service lapses?
Using these four points as a guide, you can carry out web server monitoring and quickly and proactively locate any problem in your service.


Monitoring server-status
The first utility to make use of in your web server monitoring is Apache’s native server-status. To enable it edit the file configuration, normally found at:
/etc/httpd/conf/httpd.conf
And add the following block to the end of the file:
ExtendedStatus On
SetHandler server-status
Order deny,allow
Allow from localhost, 192.168.50.1
In this case, localhost and 192.168.50.1 are the IP addresses from where it’s possible to consult your web server’s server-status. It’s necessary to replace or add additional IP addresses in function of the machine from which you’re going to perform the consultation. After reinitiating the service you’ll get some useful data about your web server: http://ip_address/server-status
A screen like the one below will display:
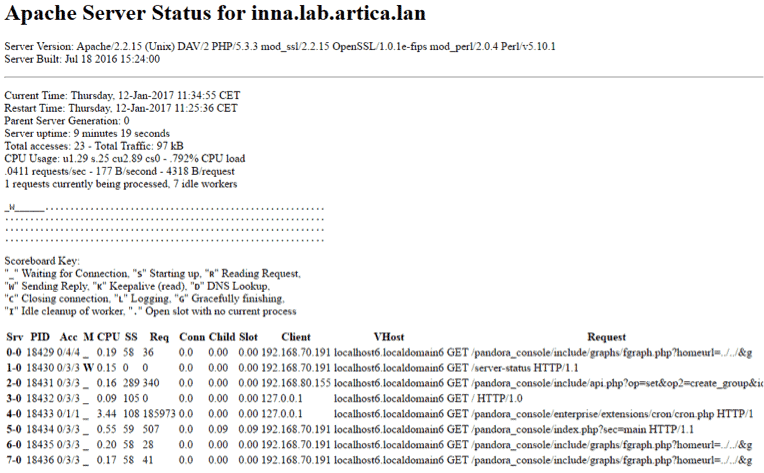
This is the screen from which you’re going to monitor your web server and extract some of the most important parameters, such as: CPU usage, Server uptime, Total access, Total traffic, etc. Pandora FMS features a plugin agent on the console which automatically handles all these checks. To get it working it needs deploying on a software agent which is connected to the web server you want to monitor; it can be an agent installed on the actual web server, since those metrics are provided directly by Apache’s server-status service and the results are constant, independently of where the consultation is made.
Want to know more about server monitoring? Discover Pandora FMS
Pandora FMS is the all-in-one server monitoring software to control your business at any level. Discover how to manage your server monitoring needs with our Enterprise version, which is perfect for more than 100 devices.
Some of the checks the plugin will show when it starts receiving information from the server-status are:
- Total Accesses
- CPU Load
- Uptime
- RequestsPerMinute
- BytesPerSecond
- BytesPerRequest
- BusyWorkers/Server
- IdleWorkers/Server
The plugin parses the information coming from the Apache server-status, collecting the information in the form of modules and carrying out web server monitoring, as in the following screenshot:
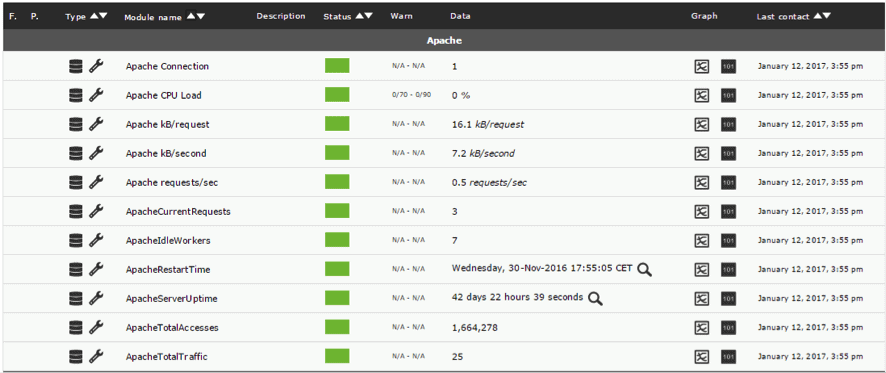
It’s worth highlighting that, since the server can be configured in different ways the load will depend on each system, meaning the plugin won’t return thresholds. The thresholds (Critical, Warning) have to be manually adjusted after a time, unless you know the limits of certain metrics.
Monitoring active connections with netstat
At a system level, this allows you to monitor open connections using the netstat utility. This program allows you to get information about your server’s connections, and visualize established and pending connections, which represent an amount of interesting, low-level data. You’ll also need to have a software agent installed on your Pandora FMS to be able to create different checks in function of the information you want to find out. In the following examples let’s look at some of the most common cases you might want to monitor with netstat, and the results on the Pandora FMS console.
Connections established for port 443 (https)
module_begin

module_name Conn_Established_443

module_type generic_data

module_exec netstat -an | grep ESTAB | grep "443 " | wc –l

module_end
Thanks to this check, you can find out how many connections have been established with the port 443 (https), giving you an idea of the workload it’s supporting, when it peaks, and more.
Connections waiting to be closed on port 443 (https)
module_begin

module_name Conn_TimeWait_443

module_type generic_data

module_exec netstat -an | grepTIME_WAIT | grep "443 " | wc -l

module_end
Showing connection spending closure on behalf of one of the participants; if there is a high number of pending connections it may be indicating a problem.
Hanging connections waiting to close (in general)
module_begin

module_name Conn_FinWait2

module_type generic_data

module_exec netstat -an | grep FIN_WAIT_2| wc -l

module_end
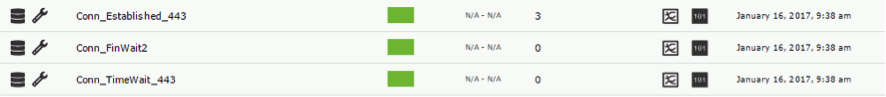
In this case, FIN_WAIT_2 is an unusual status type, but its appearance could be a problem. It’s used when communication isn’t associated with a port, but instead with a service it’s listening to. It’s visualized in the following way on the Pandora console once they are collecting data:
Monitoring the access_log
You can also monitor the web server locally with the access_log file, and sift the data it contains to create modules with useful information.
Some cases that may be interesting:
- Total number of requests per second..
- Total number of requests per second to a specific URL, or resource.
- Number of petitions per second from a specific IP.
Total number of requests per second
A basic and essential metric. Note that it represents a request rate per second and not an absolute value. The Pandora FMS module type generic_data_inc handles collecting values and calculates the result to show a number per second:
module_begin

module_name Request_Sec

module_type generic_data_inc

module_exec wc -l /var/log/httpd/access_log

module_end
Total number of requests per second to a specific URL
Similar to the previous metric, but indicating a specific URL:
module_begin

module_name Request_ContactForm_Sec_

module_type generic_data_inc

module_exec grep "/en/company/contact/" /var/log/httpd/access_log | wc -l

module_end
Number of requests per second from a specific IP
Similar to the previous checks, but restricted by IP:
module_begin

module_name Request_ContactForm_Sec_

module_type generic_data_inc

module_exec grep "108.162.221.225" /var/log/httpd/access_log | wc -l

module_end
It’s fundamental that in order for the checks to not overload the local machine, the Apache access log is in the system of log rotation to not go over 100MB. One option is to use Apache’s rotate configuration and modifying logrotate.d/httpd and adding the line: maxsize 100M
Website monitoring
Apart from the internal web server monitoring it’s possible to do, a definitive test you can perform to find out if the service functions correctly is website monitoring. Carrying out a couple of checks is enough to know if your web page is up and running, and the response times it’s returning.
Transactional web monitoring
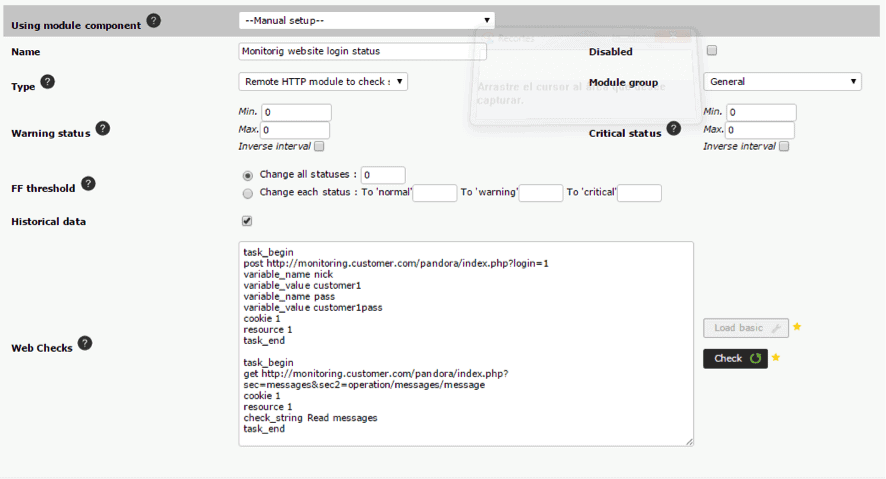
Monitoring websites and web transactions is an Enterprise feature; however, let’s take a look at a common example, and see some alternatives for “manually” monitoring our website. Using the following module configuration you can check your website’s status r.e. monitoring. It also carries out a transaction that implies various steps:
1. Load the website.
2. Login to the website: allows another series of issues to be identified, such as the connection with the database in case the login is unsuccessful.
3. Navigate to a specific section.
Configure the website as follows, and establish “module to check server response” to check if the process has been successful:
If the “check server latency” module is configured, it times the completion of a complete web-based transaction. Both modules are viewed like this once initialized:

To implement this kind of web server monitoring it isn’t necessary to install a software agent, as the checks are carried out remotely by the Pandora FMS server itself, requiring http access from the server to the website you want to monitor.
Web check via software agent
If you don’t have the Enterprise version, you can execute a check directly by using a software agent using curl pto check the web page is available. In this check, the origin of the check is important and the software agent needs http communication with the website in question; different results are returned, depending on the physical location of the agent. To run a simple diagnostic to confirm a website is responding, use the following:

As you can see, the value 1 is returned if the web returns “200 OK”. The module shows the following configuration:
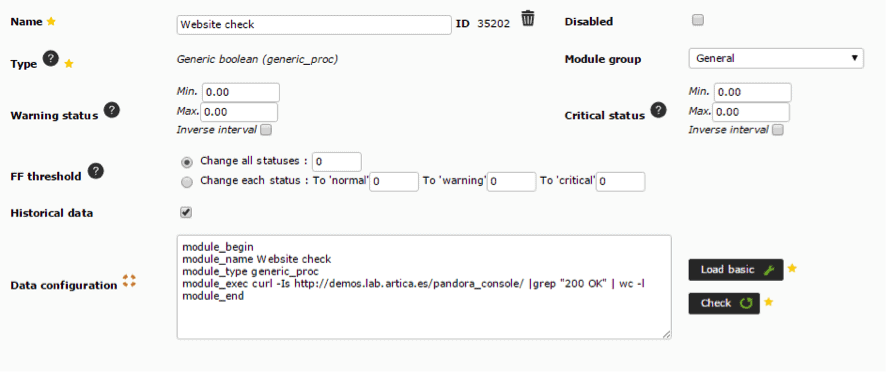
![]()
Using the curl utility the website’s latency times can also be monitored, using a similar check to the one below:

It returns the response time, in seconds, and looks like this on the module:
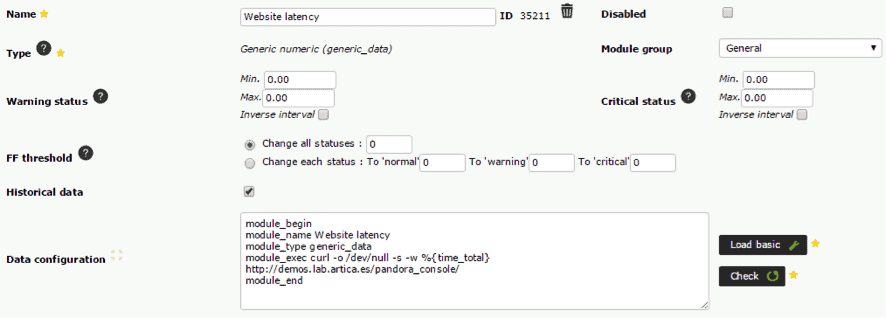
![]()
Agentless web server monitoring, via simple TCP checks
Using the basic TCP port checks on Pandora FMS Open version, you can check if a service is up. This diagnostic runs from the Pandora FMS server, rather than from an agent, and requires a TCP dialog to be configured to guarantee that the service returns the expected reply:
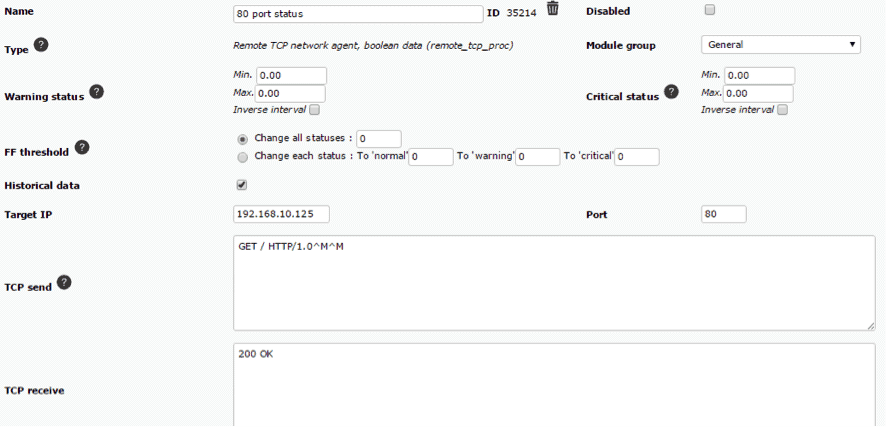
![]()
User-experience monitoring with Selenium
A way of monitoring complex web browser processes on big websites which employ flash, java, etc. using Selenium. All the navigation processes are recorded by a specific Selenium extension, which stores all the actions executed by the user directly on the browser. Afterwards, these recorded sessions are used to sequence the navigation on any real browser, and reliably monitor user experience. The plugin takes care of checking the validity of each step in the process and the whole sequence, as well as indicating response times and latency.
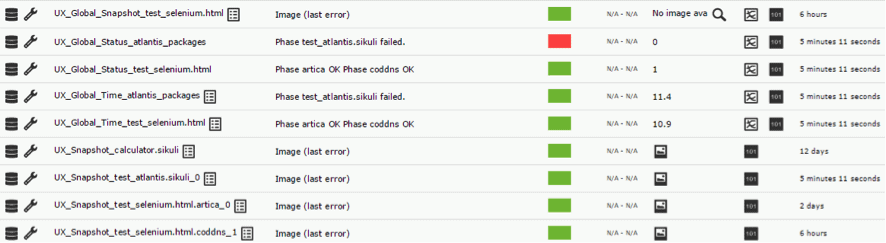
Furthermore, with the latest developments in this area on behalf of the Pandora FMS team, it’s now possible to recover a screenshot from the last page loaded, and where the error occurred.
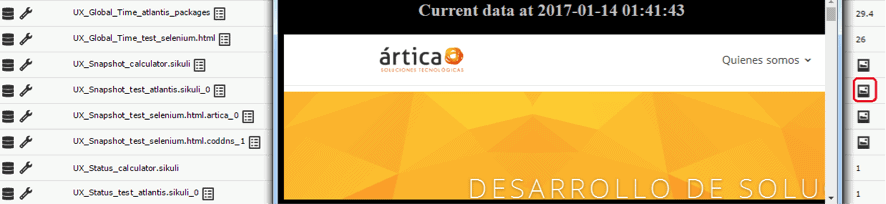
This kind of web server monitoring can be executed from any software agent, meaning that the results may vary according to the geographical location of the system where the agent is installed, the same case as with monitoring with agents and curl, so it is possible to know the availability and response times of your website from almost anywhere in the world.
Pandora FMS’s editorial team is made up of a group of writers and IT professionals with one thing in common: their passion for computer system monitoring. Pandora FMS’s editorial team is made up of a group of writers and IT professionals with one thing in common: their passion for computer system monitoring.


