


E-commerce has grown into an almost two trillion dollar market since the first online purchase (of cannabis!) was made back in the heady, freewheeling days of ARPANET in the early 70s. Those pioneers of online consumer activity from Stanford and MIT were certainly interested in their particular user experience, and surely in gauging exactly how mellow it was, but PDR UX monitoring has little to do with monitoring chocolate deficiency levels or pizza delivery networks and everything to do with gaining oversight over an important business area that is facing questions and issues of the kind that every sector faces when it grows quickly and piecemeal.
The need to perform transactions electronically has led to the proliferation of online platforms, services, and suppliers; the need for new applications and their respective operating systems to work together on large networks; the density of network traffic and the availability of websites; all these challenges have brought about the need for a new area of monitoring. The latest upgrade of Pandora FMS – version 7 NG – covers all these issues with its new user experience monitoring function: Pandora FMS UX. It records browser and/or desktop activity, generating a series of modules that are then loaded on to the Pandora FMS server to be processed.
These modules contain data about the whole process, from start to finish, timings and, in case of error, screenshots showing where such errors have been produced.
Pandora PDR UX monitoring has two modes: web browser monitoring, and desktop activity monitoring.
- Pandora Web Robot (PWR): web browser monitoring which replicates a fictitious user’s activity, checking sequences of actions and their constituent sections (or phases), and timings.
- Pandora Desktop Robot (PDR): replicates Windows desktop activity; oriented primarily to monitoring heavy desktop applications.
This second function is the focus of this article. Replicating desktop activity might be something like moving and clicking the mouse, or using the keyboard, which the system will do automatically, replicating user activity.
Say you want to monitor your FTP server. To record the process:
- Open the app to connect to FTP (e.g. FileZilla)
- Copy a file to your desktop
- Open the file and check the contents
- Delete file
The whole of this process can be automated, as we’ll see shortly. Check that the sequence is valid from start to finish (the recording was successful), and the timings.
We’ll also take a look at how to divide the recorded sequence into different phases with the objective of measuring the time taken, of the whole sequence and also of each of the individual phases, and how to subsequently analyze the data. Using the feedback we’ll be able to see that connecting to the FTP server is the slowest part of the operation, indicating possible performance issues. Or you might find that opening the FTP client is the lengthiest part of the operation, meaning the PC lacks necessary resources.


PDR: UX desktop monitoring
Setting up your environment
PDR monitoring only runs on Windows, and is recommended for virtual machines. Prerequisites:
- Windows in desktop mode with auto start and auto login
- Create directories: C:\PDR and C:\probes.
- PDR.zip file decompressed and provided in C:\PDR.
PDR session recording
Now you’re ready to start recording.
Just to simplify, the recording will consist of the following: open Windows calculator, calculate something and check the result is correct. This tells you if the calculator works and how long it takes to start up and perform the operation. With this as your baseline test you can now monitor any desktop application, by simply automatically replicating user activity such as mouse clicks and text input.
Start pdr.cmd, decompressed in C:\PDR, and after it loads you’ll see this:
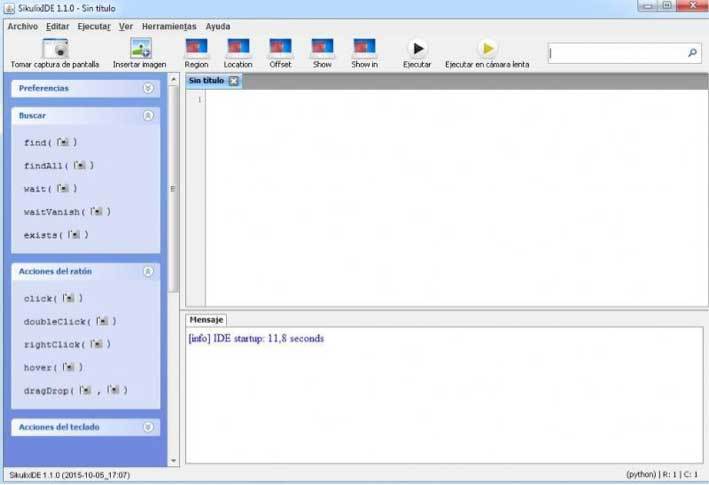
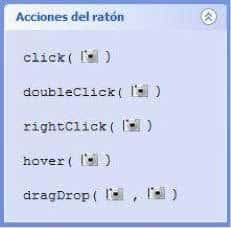
On the left hand menu are some typical actions. Select the action and the area where you want to apply it.
General actions:
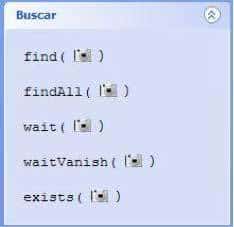
Flow controls:
Let’s look at the calculator again, and see how to record a session:
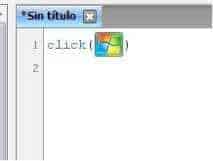
1. Choose “click” and the location where you want to apply it and the screen will show “area selection” mode:

You’ll see this:
2. Introduce “type” and “calc”, and afterward the ‘’wait’’ actions and “calculadora” (calculator) and click on it when it appears. When the calculator window opens input the following actions, like so.
3. Introduce the actions one by one, like so:
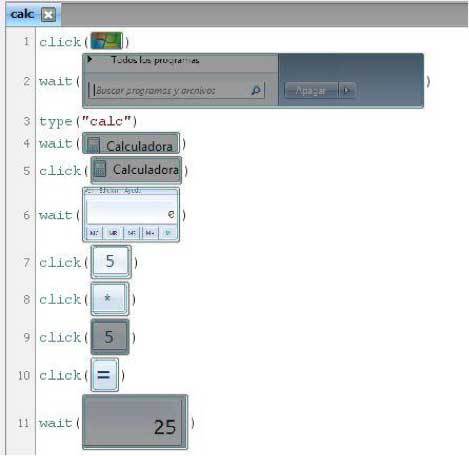
4. Save the process, and replay by clicking “Run”.
Note:
- To fine-tune any of the actions (e.g. selecting an exact point to click) double-click on any of the images in the control screen.
- Insert wait between each click to ensure the execution isn’t detained by any delay in the OS.
- The recorder will look for the same area as in the control screen, so take care that nothing is selected (cursor hovering over an element, for example).
The recording system has many possibilities but it has a steep learning curve. Play around with it, recording different sessions, replay them, and so on, before making your own recordings and launching them with Pandora FMS.
When you save the project, a folder is created with a .py file containing the automated script code and the control images from the sequence.
Recording a transaction session
Let’s expand on the previous example, again using the calculator to perform an operation and then save the result in a text file. This is a longer process, so let’s divide it into three and get timings for each of the phases.
To record a PDR transaction session in three phases, just set up to record each phase individually. This means you don’t have to modify a recording and split it into three (as was necessary with PWR). This way, different scripts are recorded separately and Pandora UX reconstructs the whole transaction, based on the execution indicated.
Follow this order:
- Open calculator and do the sum.
- Copy the result, open a notepad, and paste.
- Save the notepad file.
Now let’s look at how to execute different PDR scripts to make up a complete transaction.
Executing PDR sessions
Execution consists of a call to the binary pandora_ux_x64.exe, and the necessary arguments to replay the recordings. Firstly, check it from the command line, to make sure that the process has successfully completed. Once you have the green light, add it to the agent configuration file with module_plugin, so that it can take control of automatic execution.
Execute as follows:
pandora_ux_x64.exe -exe C:\PDR\pdr.cmd -args -r -script C:\pandora_ux\calculadora.sikuli -folder C:\pandora_ux\ -ss_config active
Indicate the complete routes for all files and directories involved.
Parameters:
-exe: pdr.cmd file route.
-args –r: pdr.cmd file arguments.
-script: directory with session guidelines.
-folder: where you’re going to save the control screenshots. Save with backslash -> \
Additional parameters are –checkpoint, which shows a screenshot of the last point of the process; and, –post, which allows you to execute commands after replaying the whole sequence, very useful to check there are no processes or windows still open.
The modules are:
- UX_Status_project_name.
- UX_Time_project_name.
- UX_Control_Snapshot_project_name (only on the first execution).
If any phase contains an error, the following module will also be created:
– UX_Snapshot_project_name.
The complete configuration line to use in the agent’s configuration file should look something like this (one complete line):
module_plugin C:\Users\artica\Documents\Producto\UX-Trans\ux\pandora_ux_x64.exe -exe C:\PDR\pdr.cmd -args -r -script C:\PDR\calc.sikuli -folder C:\PDR\ -ss_config active -checkpoint -post "taskkill /F /IM calc.exe"
Once the line’s been added to the agent, remember that it has to run in process mode to interact correctly with the desktop. Execute the agent as follows (from a terminal with cmd.exe and permissions):
"C:\Program Files\pandora_agent\PandoraAgent.exe" --process
The desktop will start to move of its own accord, replaying the recording. Don’t interrupt the process.
When the process has finalized and the data sent to the Pandora FMS server, you’ll see the modules on the console with their designated names:

Executing PDR transaction sessions
To replay sequences as transactions it isn’t necessary to modify them, only to record them as different sessions and then specify the corresponding parameters so that Pandora UX interprets them as a transaction process containing various phases.
Make three different recordings:
- Open calculator and perform simple operation (script calc.sikuli).
- Present result as a plain text file (script savecalc.sikuli).
- Save text file in a specific location, overwriting previous (script savefile.sikuli).
Now that there are three recordings, let’s see how to execute them so that each one represents one phase in a complete process.
Execute following:
C:\Users\artica\Documents\Producto\UX-Trans\ux\pandora_ux_x64.exe -exe C:\PDR\pdr.cmd -args -r -t calculadora_fases -script C:\PDR\calc.sikuli,C:\PDR\savecalc.sikuli,C:\PDR\savefile.sikuli -folder C:\PDR\ -ss_config active -checkpoint -post "taskkill /F /IM calc.exe"
As can be seen, it’s slightly different from the individual execute.
The new parameters are:
-t: this argument indicates the name you want to give to the whole process, made up of all the transactions.
-t calculadora_fases
-script: the same as in the individual execution but now separated by commas.
-script C:\PDR\calc.sikuli,C:\PDR\savecalc.sikuli,C:\PDR\savefile.sikuli
Replay the scripts one after the other, to make sure that they complete correctly. If everything’s A-OK, add the execute line below to the agent’s configuration file (as a single line):
module_plugin C:\Users\artica\Documents\Producto\UX-Trans\ux\pandora_ux_x64.exe -exe C:\PDR\pdr.cmd -args -r -t calculadora_fases -script C:\PDR\calc.sikuli,C:\PDR\savecalc.sikuli,C:\PDR\savefile.sikuli -folder C:\PDR\ -ss_config active -checkpoint -post "taskkill /F /IM calc.exe"
When the agent executes in process mode, you’ll see the modules on the Pandora console like so:
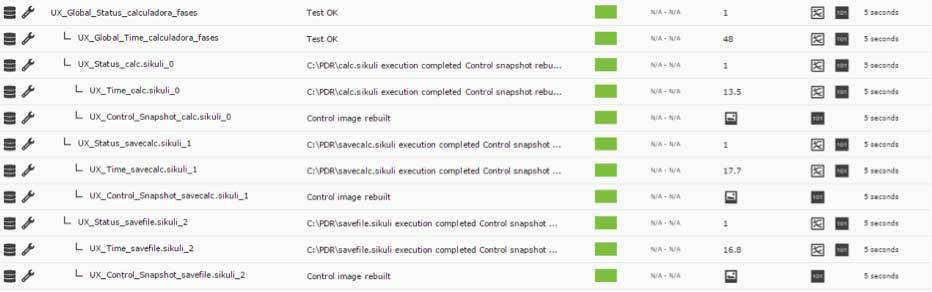
As you can see, the three phases have been included in Calculadora_fases, and timings for each are shown. Using these modules you can generate alerts and view their respective graphs individually, or even combine them for comparative purposes and present them in reports.
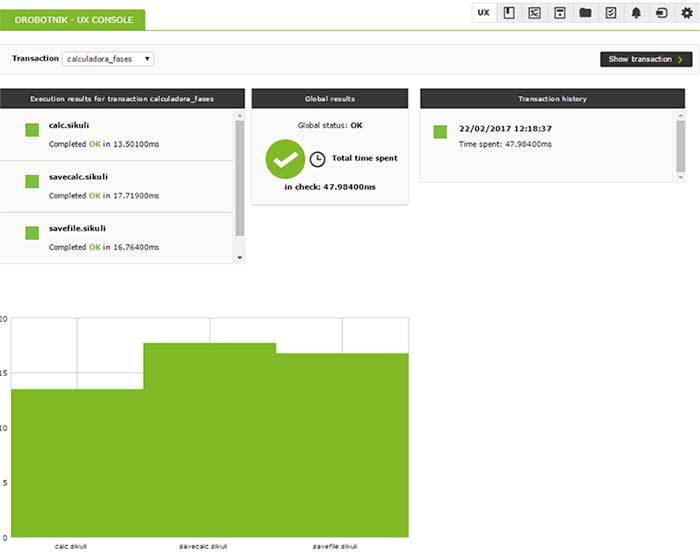
Access the UX section of the agent on the console to view the same information:
About Pandora FMS
Pandora FMS is a flexible monitoring system, capable of monitoring devices, infrastructures, applications, services and business processes.
Of course, one of the things that Pandora FMS can control is the hard disks of your computers.
Would you like to know more about what Pandora FMS can offer you? Discover it by entering here: https://pandorafms.com
If you have more than 100 devices to monitor, you can contact us through the following form: https://pandorafms.com/en/contact/
Also, remember that if your monitoring needs are more limited you have at your disposal the OpenSource version of Pandora FMS. Find more information here: https://pandorafms.org
Do not hesitate to send us your queries. The Pandora FMS team will be happy to assist you!
Pandora FMS’s editorial team is made up of a group of writers and IT professionals with one thing in common: their passion for computer system monitoring. Pandora FMS’s editorial team is made up of a group of writers and IT professionals with one thing in common: their passion for computer system monitoring.


