


Network traffic analysis as a foundation for monitoring
Monitoring has always relied on both network administration and network traffic analysis. Both fields provide ways to obtain data that allows us to obtain information about the general state of the platform.
It is easy to understand that when faced with, for example, an application performance problem, we want to be able to observe and evaluate the traffic generated, and this is just what network traffic analysis does.
This natural first impulse to observe traffic is actually justified, as traffic analysis has proven useful in identifying problems such as configuration errors, server performance deterioration, latency problems in some of the network components, and so many other error conditions.
Two ways to do network traffic analysis
There are at least two ways to perform network traffic analysis: packet analysis and network traffic flow analysis.
In both techniques, of course, the goal is the same: to obtain information on network traffic that can be presented in an interface that facilitates its evaluation.
The differences between one form and the other are concentrated in the methodology used.
Packet analysis gives the possibility to evaluate network traffic from packet to packet, while flow analysis aims to collect metadata or traffic information and to facilitate statistical analysis.
Let’s take the following diagram as a guide:
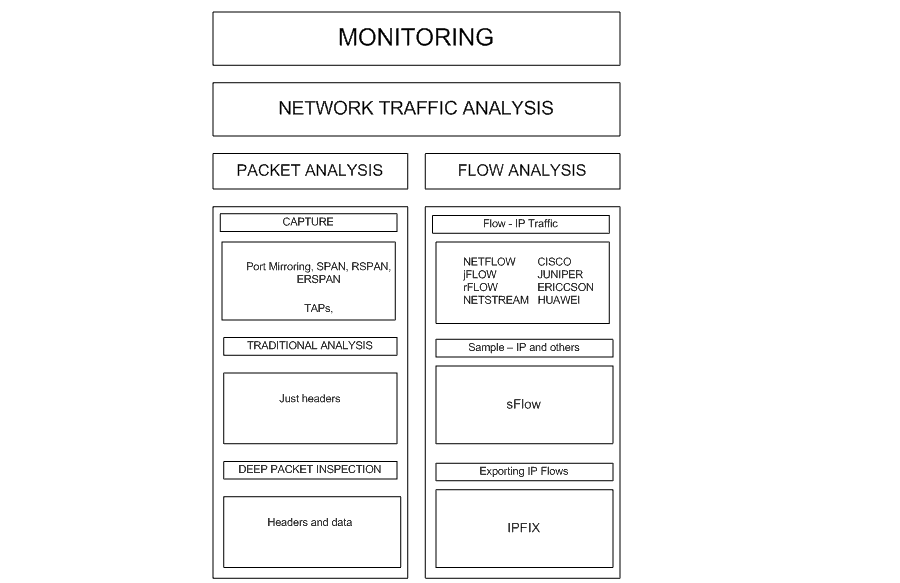
Description: Diagram with the relationship between monitoring and analysis of network traffic and network administration.
About packet analysis
Packet analysis is based on the application of capture techniques, such as the configuration of SPAN ports (Switch Port Analyzer) or the installation of equipment such as TAPs (Terminal Network TAPs) to access network traffic.
Actually, TAP devices were developed to cover certain deficiencies that arise when applying SPAN ports, such as the dependence on the processing resources of the switch where they are configured and the delicate relationship between the amount of traffic we intend to capture and the capacity of the SPAN port itself.
If you are interested in specifying the conveniences of SPAN ports and network TAPs, we recommend the article published in this blog which delves into the capture of packets using network TAPs.
Once the issue of capture is resolved, two very important issues are raised:
- Traffic storage: the point is whether we can do analysis in real time or in deferred time and the cost in storage that the analysis supposes.
- The selection of the packets that we want to evaluate: in order to address this issue, the tools that implement package analysis usually offer many facilities that allow us to choose and select the packets that we want to evaluate.
The variables of choice are usually multiple, from source and destination IP addresses to the presence of a certain sequence of bytes in the packets.
Another important point to mention in terms of packet analysis is the treatment given to the data portion of the packets.
The traditional analysis of packets is maintained in the revision of the headers, leaving without visualization the portion corresponding to the data.
This approach has three justifications:
- With the evaluation of the headings there is a lot of information that can be inferred.
- By bypassing the data portion, storage costs are kept at bay.
- The portion of data usually has sensitive information for users and for the organization, so its evaluation can lead us to violate security and data protection rules.
However, for years Internet traffic has been evaluated under the precepts of a technique known as deep packet inspection.
The deep packet inspection contemplates the review and evaluation of the headers and the data portion of the packets.
Recently, its application has transcended the scope of Internet traffic and has shifted to business traffic, of course with many controversies over possible risks to data privacy.
If you are interested in knowing in more detail the implications of the deep inspection of packets we recommend our article on this subject, published a few months ago in this blog.
Do you want to know more about network monitoring?
Remote networks, unified monitoring, intelligent thresholds… discover network monitoring in Pandora FMS Enterprise version.
About traffic flow analysis
Traffic flow analysis proposes the following:
- To evaluate network traffic based on common characteristics. In other words, the starting point is an abstraction -called “traffic flow”- that corresponds to all the traffic that shares certain common characteristics and moves from one network host to another.For example, if we consider all the traffic that a station and a server can share, that traffic that is part of the same conversation or has the same objective will be considered as flow.
- The flow is not stored as such, only the metadata. The idea is to use the devices involved in the passing of network traffic to, without storing the packets that make up the traffic flow, generate information about the traffic flow or its metadata.
This metadata must then be stored and reprocessed to finally be shown with the idea of allowing analysis, whatever: monitoring, security, forensics, billing, etc..
The traffic flow analysis has been based on a group of protocols that allow to implement the processes of generation, transport, storage and preprocessing of metadata.
It is important to clarify that these protocols do not specify how the analysis should be done; they leave it to the tools that use metadata to achieve their objectives.
There are two protocols that represent two different approaches to implementing traffic flow analysis: NetFlow and sFlow.
NetFlow
NetFlow is a protocol developed by Cisco that has become a proven standard for the implementation of IP traffic flow analysis. In addition to Cisco, many companies, both network device manufacturers and solution developers, include support for this protocol.
NetFlow introduces an architecture that has the following components:

Descripción: Arquitectura NetFlow
- Exporter: They are in charge of collecting metadata from the incoming and outgoing IP traffic flows of some network device.In fact, exporters are pieces of software that are contained in devices such as switches and routers.Exporters use a repository called NetFlow cache to store information about the flows they capture as traffic enters and exits through the switch or router device.
- Collectors: In charge of receiving metadata from exporters, storing it and pre-processing it.
- Analyzer: This is the element in charge of allowing the analysis of the information contained in the collectors.
The tasks of collector and analyser are regularly supplemented by applications that use NetFlow.
NetFlow has evolved over time, from version 5 to version 9; protocols such as IPv6 or technologies such as VLANs, MPLS and BGP have been included.
On the other hand, NetFlow version 9 derived another protocol known as IPFIX (IP Flow Information Export), which aims to regulate the way information is sent from Exporters to Collectors.
There are several improvements that IPFIX introduces; on the one hand we have the support to fields of variable length and the possibility of including data normally associated with network administration (SNMP and Syslog).
If you are interested in learning more about NetFlow applications, we recommend you to read the article about NetFlow published in this blog.
sFlow
From NetFlow other manufacturers have developed their own flow analysis protocol; in general they all follow the same architecture of Exporters – Collectors – Analyzers and are maintained in the IP traffic environment.
Below is a list of protocols derived from NetFlow:
| Protocol | Home Manufacturer | ||
| NetFlow | Cisco | ||
| jFlow | Juniper | ||
| rFlow | Ericcson | ||
| NetStream | Huawei | ||
As stated above, most are approximations to NetFlow without too many variations. However, something different happens with the sFlow protocol.
SFlow (Sampling Flow), which was developed by InMon Corporation and published in RFC 3176, introduces a noteworthy change.
SFlow does not work with the abstraction that has been mentioned so far, flows, and concentrates on the activity of collecting samples.
When using sFlow the sampling radius is defined ¨n¨; thus, each n packets the sFlow exporter will take a sample of the packets considering all levels, from 2 to 7, in the OSI model and all present protocols, not only IP.
From the samples, sFlow will keep the initial bytes, will add the counters and will pass all this information to the sFlow collectors.
So, we are with NetFlow having information about IP flows, considering layer 3 and 4, while with SFlow we have samples of any protocol considering from layer 2 to layer 7.
This leads us to consider sFlow a broader protocol and less consumption of resources in the Exporters, which scales well but that, being based on sampling, can leave some traffic without evaluation.
That said, the reader can correctly assume that there is controversy. Which protocol is better?
If you are interested in this, do take a look at this article published in comparitech and this one published in pcwdld to get into the subject.
NetFlow and Pandora FMS
Pandora FMS, as a general purpose monitoring tool which includes the use of network traffic analysis techniques.
In fact, Pandora FMS includes integration to traffic capture equipment such as TAPs and also supports NetFlow.
Integration with NetFlow is achieved by establishing Pandora FMS server as a NetFlow Collector and Analyzer. This integration involves the use of a free software tool called nfcap.
Once the tool is installed, the daemon will start automatically and the scheme presented by Pandora FMS will offer then a very flexible scheme of filters that will allow choosing with precision the traffic you want to evaluate.
If you are interested in checking a Pandora FMS and NetFlow integration scheme, using a Raspberry device, we recommend you to check this interesting article.
Of course, NetFlow support is only one of the many facilities provided by Pandora FMS.
If you are interested in knowing more about Pandora FMS, we invite you to check this link: https://pandorafms.com/network-monitoring/
If you want to know better what Pandora FMS can offer you, you can enter here:
https://pandorafms.com/
In case you have more than 100 devices to monitor, you can contact the Pandora FMS team through the following form: https://pandorafms.com/contact/
Also, remember that if your monitoring needs are more limited you have at your disposal the OpenSource version of Pandora FMS. Find more information here: https://pandorafms.org/
Don’t hesitate to send us your questions. Our Pandora FMS team will be delighted to help you!
Pandora FMS’s editorial team is made up of a group of writers and IT professionals with one thing in common: their passion for computer system monitoring. Pandora FMS’s editorial team is made up of a group of writers and IT professionals with one thing in common: their passion for computer system monitoring.


