


Microsoft SCOM, component for monitoring. Here we go!
Microsoft SCOM is an advertised software for Microsoft Windows® administration, but today we will show you that its base rests on well known monitoring techniques. Just to be clear, we emphasize the term in bold: Microsoft System Centre Operations Manager ®. It turns out that the name System Centre encompasses a large amount of software owned and acquired from third parties, and at the time of writing we had 73 different products, including, for example, Microsoft System Centre Essentials® or System Centre 2016 Virtual Machine Manager®. For those of you who like digital archaeology, we have provided the detailed history of System Centre Operations Manager ® in the online encyclopaedia “Wikipedia”. Therefore, let’s start with our journey!
Microsoft Offices in Germany
Microsoft System Centre Operations Manager ® (Microsoft SCOM)
You see that the simplest thing is to name it as Microsoft SCOM and for its companion the System Centre Configuration Manager® we will abbreviate it as Microsoft SCOM, throughout this writing.

Monitoring “smartphones”
The world of monitoring does not discriminate at all between free software and proprietary software; even “smart phones” can be monitored, but what is a great truth is that the treatments given to each one are, and must be, different. For this, SCOM has specially developed the Management Pack, which covers both types of software. But we’d better take a closer look at the components first.
User interface
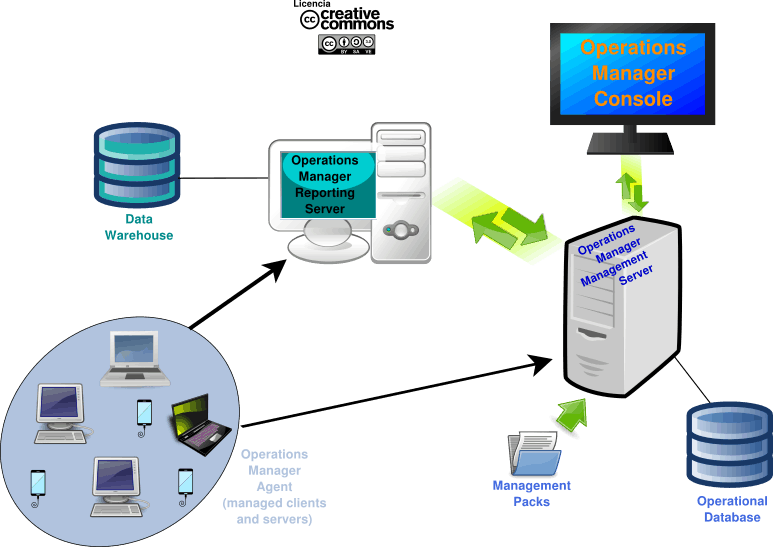
System Center Operations Manager ®: main components
The image above contains more than a thousand words; let’s start with the Operations Manager Console, to which users and administrators have access, who due to SCOM’s way of working present minimal differences. This console is a stand-alone application that connects to a root server of the Operations Manager Management Server (OMMS) type. Although there is a web console, it does not contain all the options of the Operations Manager Console (OMC). In the graph above both are represented in a single object – for simplicity – but another component is missing: through the command line and using Powershell® many tasks can be automated, and sent as custom views that we can see on screen under three categories:
- Event views.
- Alert views.
- Performance views.
Servers and Agents
From an Operations Management Server root we can have as many secondary servers as we need. Each agent installed on each device connects to the root server and informs you in an encrypted manner – using Kerberos – about:
- Events: which collect through Windows Management Instrumentation, logs and even SNMP to devices such as routers and hubs that support this protocol. Again, remote monitoring with SNMP is not represented in the image, but we point out that even root and secondary servers can optionally perform this task as well.
- Alerts: have full priority and are immediately sent to the console.
- Performance: Agents regularly send collected metrics.
Root servers can modify the behaviour of agents, such as stopping them totally or partially, or even asking them to perform an additional task, which can either be requested by a human being or can be previously defined in an object that, we believe, can behave like an application in itself: the Management Packs.
Management Packs (MP)
No one is capable of having and/or knowing and/or hoarding all knowledge, whether a person or a large corporation. That’s what the MP‘s were designed for. An MP also has an interesting structure, taking into account many factors, and what we consider main is that they can be developed by third parties to leave the door open into the future: any existing device (a Cisco router, for example) or other totally new that is invented can develop its particular MP. Don’t you think that’s enough? Then add any application or software to the list: even knowledge and experience can be embedded in an MP. How is this possible? With a structure summarized such as this one:
- Rules: define the events and/or alerts and/or performances (metrics) to collect. Remember that a root server can request an agent to perform a specific task? Well, this task can be defined when an alert occurs (which in turn is caused by a series of “summed” events). We take this opportunity to indicate that the events are sent by the agents to both types of servers, the OMMS and the Operations Manager Reporting Server (OMRR), with the difference that while in the OMMS the data are converted into information, summarized and discarded in a few days, in the OMRR or are jealously guarded.
- Tasks: defined in point 1, we extend them here. Apart from being executed in an agent, they can also be executed in a WTO. Not only can it be a Powershell® script, it can also be an operating system shell script, a VBScript script or a binary executable.
- Monitors: are responsible for constantly monitoring a metric and according to its value define a state, and is even able to send an alert if that state changes.
- Discovery rules: which govern the remote monitoring explained in the Servers and Agents section.
- Views: inserts in the WTO the graphic interface(s) specially designed for the MP in question.
- Reports: operate in the same way as Views.
- Knowledge: they can be written in several languages and will be shown to the user before an event or alert, which will guide the user to decide to execute one of several predefined tasks. It saves thousands of person-hours of technical support.


Service Monitoring
Not only third parties can create MPs: WTO administrators can also create them to monitor their own services as a whole. Suppose that the company needs a database, a web server to access it: it is possible to define these services, whatever they are, from Microsoft, own or third parties. There are many combinations and depend on each individual company.
Reporting Services
Microsoft SQL Server has a component called SQL Server Reporting Services, which receives the reports defined by the users or in the MP’s, and they are interpreted -and shown by the WTO- according to the data received by the OMRR directly from the agents.
Pandora FMS
We did it again: throughout the article you have links about how Pandora FMS handles the different aspects of the science -and art- of monitoring.
Our Enterprise version is just a click away. Don’t hesitate to contact us!

Programmer since 1993 at KS7000.net.ve (since 2014 free software solutions for commercial pharmacies in Venezuela). He writes regularly for Pandora FMS and offers advice on the forum . He is also an enthusiastic contributor to Wikipedia and Wikidata. He crushes iron in gyms and when he can, he also exercises cycling. Science fiction fan. Programmer since 1993 in KS7000.net.ve (since 2014 free software solutions for commercial pharmacies in Venezuela). He writes regularly for Pandora FMS and offers advice in the forum. Also an enthusiastic contributor to Wikipedia and Wikidata. He crusher of irons in gyms and when he can he exercises in cycling as well. Science fiction fan.


