


Monitoring CPU temperature with Pandora FMS
CPU temperature is one of the most important metrics to keep in mind when it comes to monitoring hardware. An overheated CPU can cause sudden system interruptions, as a self-protecting mechanism, or melt the CPU or even render it outright lifeless.
If you don’t want your production systems, databases, backups, web servers or hardware to go down as a result of CPU overheating, read on. We’re going to outline a few ways of implementing CPU temperature monitoring using Pandora FMS on Windows and Linux systems, and network devices. Get a heads up on values, different types of alerts and be pro-active when problems come up.
Windows
The wmic utility allows you to get all kinds of information by using Windows WMI. To monitor CPU temperature, execute the following command from a cmd with admin privileges;
wmic /namespace:\\root\wmi PATH MSAcpi_ThermalZoneTemperature get CurrentTemperature
This will give you the CPU temperature in Kelvin. If you want the data in Celsius, use the operation:
Celsius_Result = (Kelvin_Result / 10) – 273
We’ve created a module on our agent software with the following structure:
module_begin

module_name temperature tenths kelvin

module_type generic_data

module_exec wmic /namespace:\\root\wmi PATH MSAcpi_ThermalZoneTemperature get CurrentTemperature | tail -2

module_end
Plus a synthetic module to make the conversion from Kelvin to Celsius.
Here’s the result:

Linux
On Linux systems we can get the data differently, in function of the distribution in use. Keep in mind that this kind of check is only applicable to hardware, with heat sensors for reading CPU temperature, for example, as virtual devices are managed by software.
In the case of Ubuntu/Debian systems this information is usually found in the following directories:
/sys/class/hwmon/
On our example machine we can see the content of the following files:
$ cat temp1_input temp2_input temp3_input

43000

40000

41000
In this case the overall CPU temperature plus the temperature of each nucleus is displayed. The first two figures show degrees and the other three show decimals. Most systems don’t have precise enough sensors to display decimals, so, as a workaround to achieve a more granular definition of the metrics, you can apply a post-procedure. One module’s configuration would be as follows:
module_begin

module_name Temperature CPU 1

module_type generic_data

module_exec cat /sys/class/hwmon/hwmon1/temp2_input

module_postprocess 0.001

module_unit º C

module_end
And the result on the Pandora FMS console, would be:

Remember! As mentioned, the location of this information may vary according to the Linux distribution in use, making a brief prior investigation mandatory before creating the checks.
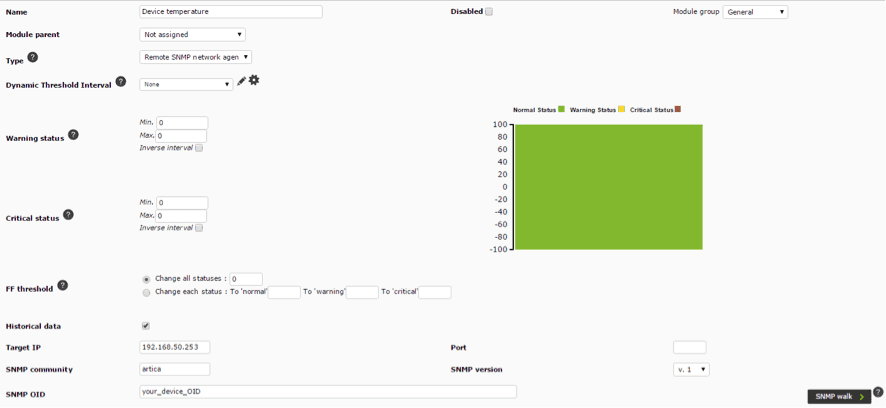
Implementation on network devices
In this case use network checks, via SNMP, which will allow you to quickly and easily get feedback on the device in question.
Again, some prior investigation is necessary, as each network device is different, with its manufacturers standards, and there isn’t a “universal value” that can be generically applied in all cases.
You’ll need the device’s IP address, its community, and SNMP version and the OID of the check. The OID will enable you to receive specific information relevant to the device in question.
The module’s configuration on the Pandora FMS console will look like this:
Pandora FMS’s editorial team is made up of a group of writers and IT professionals with one thing in common: their passion for computer system monitoring. Pandora FMS’s editorial team is made up of a group of writers and IT professionals with one thing in common: their passion for computer system monitoring.


