Augmentez la puissance de votre surveillance. Pandora FMS s’intègre aux principales plateformes et solutions cloud.
Helpdesk puissant et flexible pour les équipes d’assistance et de service à la clientèle, aligné sur les processus de la bibliothèque d’infrastructure des technologies de l’information (ITIL).
An extensive collection from detailed guides that break down complex topics to insightful whitepapers that offer a deep dive into the technology behind our software.
Expande el poder de tu monitorización. Pandora FMS es flexible y se integra con las principales plataformas y soluciones en la nube.
Potente y Flexible Helpdesk para equipos de soporte y atención al cliente, alineado con los procesos de Biblioteca de Infraestructura de Tecnologías de Información (ITIL).
Close your eyes. Imagine that, instead of being a good person reading this article at home, you are a newbie network administrator who must manage the IP addresses of thousands of devices networked on the extensive networks of a large company.
At first you use your spreadsheet…, but it’s not enough!
The tension increases and the temptation to jump out the window of the office may be too much sometimes, but thanks to the Blessed Sacrament, this text comes to mind (and to Google) where Pandora FMS blog tells you about…
Best IP Scanners, IP Scanner Tools
Listen to us, as so many times you did before. The IP Scanner or IP scanner tools are the way to save you an unattainable job on the fast track. So let yourself be carried away by the scroll of your trusted mouse, read carefully and select the option that best suits you.
Advanced IP Scanner
At the controls of this ipscan we find Famatech, a world leader in software development for remote control and network management.
In case you have any doubts, this company has already been endorsed by millions of IT professionals around the world.
Almost all of us use Famatech’s award-winning software products.
In the distant 2002, they launched Advanced IP Scanner (which continues to be developed and improved every day) and this tool proves to be of the most integral and effective to manage LAN networks and carry out all kinds of network tasks.
One of the unquestionable strongpoints of Advanced IP Scanner is that Famatech takes user recommendations on the improvement of the product seriously and gets down to work quickly.
In addition, Advanced IP Scanner integrates with Radmin, another one of the most popular Famatech products to create remote technical support.
This technological Megazord expands the capacities of the IP Scanner and can simplify your work as system administrator. IBM, Sony, Nokia, HP, Siemens and Samsung, have already joined in, surely you can’t be left behind!
Free IP Scanner
Perhaps the fastest in the wild-west scanning IP ranges, in addition to ports geared primarily for administrators and users who want to monitor their networks.
Free IP Scanner has the unique ability to scan a hundred computers per second, and it does so with ease due to its recursive process technology that greatly increases scanning speed.
It even gives you the possibility to find out the busy IP addresses within the same network and shows you the NetBIOS data of each machine.
These data, from the name to the group, including the MAC address, can be exported to a plain text file.
With Free IP Scanner you may also define scanning by IP address range, simultaneous maximum processes or ports.
All of this for free.
IP Range Scanner
Lansweeper offers us this tool for free. How much we like free stuff, huh?
If Stone City had an ad that read “Free stones”, we would be able to take a car full of stones home.
We’d do something with them!
IP Range Scanner is able to scan your network and provide all that information you are looking forward to knowing about devices connected to your network.
You may also schedule a network scan and run it when prompted.
#IPRangeScannerYourNewButler
OpUtils
Some consider “OpUtils” to be a supervillain’s name. However, nothing further from the truth.
It’s a super software for IP address management and switching port that rescues IT administrators from trees and helps them manage switches and IP address space with ease. In its belt we find more than 30 network tools, which help us perform network monitoring tasks. Including:
The super intrusion detector of fraudulent devices.
The bandwidth usage supercontroller.
Supervisor of the availability of critical devices.
The Cisco Configuration File Backup Superrunner.
Network Scanner
Network Scanner, almost the panacea.
The IP Scanner they use to scan both large corporate networks with thousands of devices and small businesses with a few computers.
The number of computers and subnets is unlimited.
And it can scan a list of IP addresses, computers, and IP address ranges and show you all the resources shared.
Including:
System shared resources.
NetBIOS Hidden (Samba)
FTP and web resources.
Ideal for auditing network computers or using it to search for available network resources.
Both network administrators and regular users can use Network Scanner. And Network Scanner will not only find network computers and shares, it will also check their access rights so that the user can build them as a network drive or open them in their browser.
Conclusions
Here are just a few examples of the top of the best IP Scanners on the market. We know you’ll have a hard time deciding.
It’s like when they put a tray of assorted sushi in front of you.
There’s no way to decree which one’s best while you’re still salivating.
Anyway, let’s name a couple more options for you to burst into uncertainty. We’re that good!
Network monitoring is a set of automatic processes that help to detect the status of each element of your network infrastructure.
We are talking about routers, switches, access points, specific servers, intermediate network elements, and other related systems or applications (such as web servers, web applications, or database servers).In other words, network monitoring can be understood as taking a look at all the connected elements that are relevant to you or your organization.
What is a network monitoring system?
A network monitoring system is that set of software tools that allows you to program those automatic polls.
That way you may constantly monitor your network infrastructure, doing systematic tests so that, if they find a problem, they notify you.
These systems makes monitoring the network easy, as they also allow you to see all the information in dashboards, generate reports on demand, see alerts and, of course, see graphs with the monitoring data relevant to you.
How does network monitoring work?
Network monitoring can be as simple as seeing devices respond to a simple command like ping. So you will see whether they are connected, switched on and “alive”.
If you do that every five minutes, you’ll be actively monitoring those machines.
We don’t care if they’re servers or routers. We’ll know that, at least, they’re there and they’re responding. When one stops responding, you’ll know something happened to it.
It can also be as basic as periodically interrogating a router for the number of bytes it has transferred, both up and down.
With that you may create network traffic graphs.
We could even add more data to it, like the number of lost packets, latency times…
These data can be combined in graphs that visually compare some values with others and even set thresholds that warn you whether a data exceeds a certain value, for example, if packet loss exceeds 10%.
If you apply that same philosophy to monitoring other data, such as the temperature in a power supply, the process will be the same: obtain the data every X time, draw it on a graph and set thresholds to generate alerts.
This is network monitoring and, as it is evident, it can be easily extended to server, application or database monitoring.
Usually network monitoring is done using remote methods, so that from one place, you may scan the network and get information from your devices.
What is a network monitoring protocol?
In order to perform these network surveys, you need what are known as network monitoring protocols. They define how communication inside a network (in order to monitor systems and devices) can be done.
There are several different monitoring protocols that allow these types of surveys to be carried out.
1. SNMP Protocol
The best known monitoring protocol is SNMP (Simple Network Management Protocol) which allows you to probe a computer and ask for different values. For example, the number of bytes you have transmitted or the temperature of your power supply.
These values are identified by a numeric code, called an OID.
For example, the OID for obtaining the temperature of a power supply on a CISCO computer is as follows: 1.3.6.1.4.1.9.9.13.1.3.1.3
2. ICMP Protocol
Another basic protocol is the ICMP, which allows to know whether the machine responds (commonly known as “pinging” or ping test).
This protocol can also be used to calculate latency times (find out how long it takes for a packet to arrive from one machine to another).
Certain network applications, such as IMAP, DNS or SMTP have their specific ports and finding out whether a service is working properly is directly related to protocol design, so more complex testing is needed.
Generally any service that is offered over the network exposes a TCP port, so monitoring that those ports are active and responsive can already be basic monitoring.
Network Monitor Basics
We could say that, in addition to the aforementioned pings, there are three methods for monitoring a network.
1. Bandwidth Monitoring
Network bandwidth is the amount of information that circulates through a network link at any given time.
This information is usually measured in bits per second and allows you to know how overloaded or underutilized your networks are.
In order to measure it, there are several tools that analyze the network bandwidth, the communication protocols used, and so on.
2. TRAP Monitoring
TRAPS are urgent notices that circulate through the network, thanks to a protocol that allows it and an emitter/collector that generates and/or collects them.
Virtually all network devices allow these urgent warnings to be sent to a trap collector.Be careful! The SNMP survey should not be mistaken with the SNMP traps.
The first is a server that asks the device regularly, using SNMP, and in the second case, it is the device that occasionally, when something happens, sends a trap to the server. Both devices can be seen as network monitors, as they perform monitoring tasks using network monitoring protocols.
3. Syslog monitoring
Another method used is log or report collection (usually via syslog).
For this, as with the traps, you must set in motion a syslog collection server that will collect logs from all the devices that you configured for this purpose.
What are the benefits of a network monitoring system?
Knowing the status of all equipment at a glance allows you to know if there are any problems and anticipate as much as possible their impact.
If something goes wrong, you’d better be the one to warn your clients or bosses, not the other way around.
If something goes wrong, in addition to knowing what went wrong, you will be able to answer questions such as:
Since when does it fail?
What other things are failing?
What was the normal performance?
What network monitoring tools are there?
From Pandora FMS we have done an analysis of the best network monitoring tools there are. We have compared them and here are our conclusions:
Prometheus seeks to be a new generation within open source monitoring tools. A different approach with no legacies from the past.
For years, many monitoring tools have been linked to Nagios for its architecture and philosophy or just for being a total fork (CheckMk, Centreon, OpsView, Icinga, Naemon, Shinken, Vigilo NMS, NetXMS, OP5 and others).
Prometheus software however, is true to the “Open” spirit: if you want to use it, you will have to put together several different parts.Somehow, like Nagios, we can say that it is a kind of monitoring Ikea: you will be able to do many things with it, but you will need to put the pieces together yourself and devote lots of time to it.
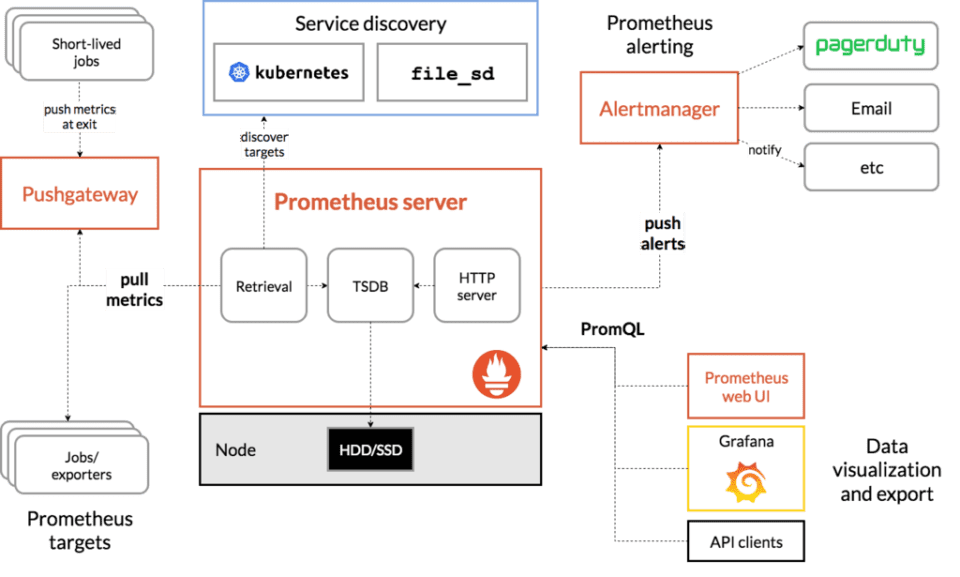
Prometheus, written in the go programming language, has an architecture based on the integration of third-party free technologies:
Unlike other well-known systems, which also have many plugins and parts to present maps, Prometheus needs third parties to, for example, display data (Grafana) or execute notifications (Pagerduty).
All those high-level elements can be replaced by other pieces, but Prometheus is part of an ecosystem, not a single tool. That’s why it has exporters and key pieces that in the background are other Opensource projects:
HAProxy
StatsD
Graphite
Grafana
Pagerduty
OpsGenie
and we could go on and on.
Would you like to monitor your systems for free with one of the best monitoring software out there?
Pandora FMS, in its Open Source version, is free forever and for whatever number of devices you want.
Let us tell you all about it here:
Prometheus and data series
If you’re familiar with RRD, you guessed it right!
Prometheus is conceived as a framework for collecting data of undefined structure (key value), rather than as a monitoring tool. This allows you to define a syntax for your evaluation and thus store it only in case of a change event.
Prometheus does not store data in an SQL database.
Like Graphite, which does something similar, like other systems from another generation that store numerical series in RRD files, Prometheus stores each data series in a special file.
If you are looking for a Time series database information gathering tool, you should take a look at OpenTSBD, InfluxDB or Graphite.
What to use Prometheus for
Or rather, what to NOT use Prometheus for.
They themselves say it on their website: if you are going to use this tool to collect logs, DO NOT DO it, they propose ELK instead.
If you want to use Prometheus to monitor applications, servers or remote computers using SNMP, you may do so and generate beautiful graphics with Grafana, but before that…
Prometheus settings
All the configuration of the Prometheus software is done in YAML text files, with a rather complex syntax. In addition, each employed exporter has its own independent configuration file.
In the event of a configuration change, you will need to restart the service to make sure it takes the changes.
Reports in Prometheus
By default, Prometheus monitoring has no report type.
You will have to program them yourself using their API to retrieve data.
Of course, there are some independent projects to achieve this.
Dashboards and visual displays
To have a dashboard in Prometheus, you’ll need to integrate it with Grafana.
There is documentation on how to do this, as Grafana and Prometheus coexist amicably.
Scalability in Prometheus
If you need to process more data sources in Prometheus, you may always add more servers.
Each server processes its own workload, because each Prometheus server is independent and can work even if its peers fail.
Of course, you will have to “divide” the servers by functional areas to be able to differentiate them, e.g.: “service A, service B”. So that each server is independent.
It does not seem like a way to “scale” as we understand it, since there is no way to synchronize, recover data and it does not have high availability or a common access framework to information on different independent servers.
But as we warned at the beginning, this is not a “closed” solution but a framework for designing your own final solution.
Of course, there is no doubt that Prometheus is able to absorb a lot of information, following another order of magnitude than other better known tools.
Monitoring systems with Prometheus: exporters and collectors
Somehow, each different “way” of obtaining information with this tool, needs a piece of software that they call “exporter”.
It is still a binary with its own YAML configuration file that must be managed independently (with its own daemon, configuration file, etc.).
It would be the equivalent of a “plugin” in Nagios.
So, for example, Prometheus has exporters for SNMP (snmp_exporter), log monitoring (grok_exporter), and so on.
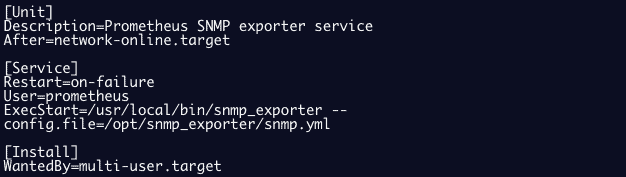
Example of configuring a snmp exporter as a service:
Prometheus monitoring exporter SNMP
To get information from a host, you may install a “node_exporter” that works as a conventional agent, similar to those of Nagios.
These “node_exporters” collect metrics of different types, in what they call “collectors”.
By default, Prometheus has activated dozens of these collectors. You can check them all by going to Annex 1: active collectors.
And, in addition, there are multiple “exporters” or plugins, to obtain information from different hardware and software systems.
Although the number of exporters is relevant (about 200), it does not reach the level of plugins available for Nagios (more than 2000).
Prometheus’ approach for modern monitoring is much more flexible than that of older tools. Thanks to its philosophy, you may integrate it into hybrid environments more easily.
However, you will miss reports, dashboards and a centralized configuration management system.
That is, an interface that allows seeing and monitoring grouped information in services / hosts.
Because Prometheus is a data processing ecosystem, not a common IT monitoring system.
Its power in data processing is far superior, but the use of that data for day-to-day use makes it extremely complex to manage, as it requires many configuration files, many external commands distributed and everything must be maintained manually.
Annex 1: Active collectors in Prometheus
Here are the collectors that Prometheus has active by default:
These “node_exporter” collect metrics of different types, in what they call “collectors”, these are the serial collectors that are activated:
arp
Exposes ARP statistics from /proc/net/arp.
bcache
Exposes bcache statistics from /sys/fs/bcache/.
bonding
Exposes the number of configured and active slaves of Linux bonding interfaces.
btrfs
Exposes btrfs statistics
boottime
Exposes system boot time derived from the kern.boottime sysctl.
conntrack
Shows conntrack statistics (does nothing if no /proc/sys/net/netfilter/ present).
cpu
Exposes CPU statistics
cpufreq
Exposes CPU frequency statistics
diskstats
Exposes disk I/O statistics.
dmi
Expose Desktop Management Interface (DMI) info from /sys/class/dmi/id/
edac
Exposes error detection and correction statistics.
entropy
Exposes available entropy.
exec
Exposes execution statistics.
fibrechannel
Exposes fibre channel information and statistics from /sys/class/fc_host/.
filefd
Exposes file descriptor statistics from /proc/sys/fs/file-nr.
filesystem
Exposes filesystem statistics, such as disk space used.
hwmon
Expose hardware monitoring and sensor data from /sys/class/hwmon/.
infiniband
Exposes network statistics specific to InfiniBand and Intel OmniPath configurations.
ipvs
Exposes IPVS status from /proc/net/ip_vs and stats from /proc/net/ip_vs_stats.
loadavg
Exposes load average.
mdadm
Exposes statistics about devices in /proc/mdstat (does nothing if no /proc/mdstat present).
meminfo
Exposes memory statistics.
netclass
Exposes network interface info from /sys/class/net/
netdev
Exposes network interface statistics such as bytes transferred.
netstat
Exposes network statistics from /proc/net/netstat. This is the same information as netstat -s.
nfs
Exposes NFS client statistics from /proc/net/rpc/nfs. This is the same information as nfsstat -c.
nfsd
Exposes NFS kernel server statistics from /proc/net/rpc/nfsd. This is the same information as nfsstat -s.
nvme
Exposes NVMe info from /sys/class/nvme/
os
Expose OS release info from /etc/os-release or /usr/lib/os-release
powersupplyclass
Exposes Power Supply statistics from /sys/class/power_supply
pressure
Exposes pressure stall statistics from /proc/pressure/.
rapl
Exposes various statistics from /sys/class/powercap.
schedstat
Exposes task scheduler statistics from /proc/schedstat.
sockstat
Exposes various statistics from /proc/net/sockstat.
softnet
Exposes statistics from /proc/net/softnet_stat.
stat
Exposes various statistics from /proc/stat. This includes boot time, forks and interrupts.
tapestats
Exposes statistics from /sys/class/scsi_tape.
textfile
Exposes statistics read from local disk. The –collector.textfile.directory flag must be set.
thermal
Exposes thermal statistics like pmset -g therm.
thermal_zone
Exposes thermal zone & cooling device statistics from /sys/class/thermal.
time
Exposes the current system time.
timex
Exposes selected adjtimex(2) system call stats.
udp_queues
Exposes UDP total lengths of the rx_queue and tx_queue from /proc/net/udp and /proc/net/udp6.
uname
Exposes system information as provided by the uname system call.
This is an example of the type of information that an Oracle exporter returns, which is invoked by configuring a file and a set of environment variables that define credentials and SID:
oracledb_exporter_last_scrape_duration_seconds
oracledb_exporter_last_scrape_error
oracledb_exporter_scrapes_total
oracledb_up
oracledb_activity_execute_count
oracledb_activity_parse_count_total
oracledb_activity_user_commits
oracledb_activity_user_rollbacks
oracledb_sessions_activity
oracledb_wait_time_application
oracledb_wait_time_commit
oracledb_wait_time_concurrency
oracledb_wait_time_configuration
oracledb_wait_time_network
oracledb_wait_time_other
oracledb_wait_time_scheduler
oracledb_wait_time_system_io
oracledb_wait_time_user_io
oracledb_tablespace_bytes
oracledb_tablespace_max_bytes
oracledb_tablespace_free
oracledb_tablespace_used_percent
oracledb_process_count
oracledb_resource_current_utilization
oracledb_resource_limit_value
To get an idea of how an exporter is configured, let’s look at an example, with an JMX exporter configuration file:
When you leave the faculty with a smile on your face and after the undertow of the graduation celebration, you hope that the great multinationals approach you with hundreds and varied jobs. “Take this huge sum of money and work on what you always dreamed of”…
But nothing could be further from the truth.
For that reason, today in Pandora FMS blog, we give you our sincere condolences for facing that load of hunting for a job related to “your stuff” and a couple of pages totally necessary to find an IT job.
*We know that there are millions of specialized people that look for an article like this, from water stocker in IT to those who prepare a megalomaniac IA in their garage, but this time we have wanted to focus on looking for an IT job.
** Even so, these pages are very versatile and are helpful for many more specialties. Look among them for a job that suits your specialties.
Do you know where you have to look for an IT job?
Ticjob
Good stuff: Ticjob. We dive right into it with one of the most valued portals of IT jobs in Spain.
Go in, thread between the offers with enough precision, since you can choose among role categories, development, system, business… Choose and forget about it. Soon you will find something!
If I were you, I would sign up immediately, because you may find companies that usually do not appear in other more well-known platforms.
TalentHackers
Talent Hackers. We already explained to you why you don’t have to fear the word“hacker”, because it can have positive connotations and, of course, it has them here.
We face here a very singular platform for job hunting:
Its aim is to catch talents within the technological scope through one distributed network. That is, by means of searching and picking up professionals through references later repaid.
What does this mean? It means that if the candidate which you recommend for a position is the selected one you can take up to 3,000 bucks.
Manfred
Manfred: “We manage talent, not selection processes”. Withthis quote, the company makes clear that it is not a common portal.
Rather, Manfred claims to be a platform that offers “IT recruitment” and gives the candidate an experience totally different from that we are used to with the rest of this type of services.
Manfred takes less into account the necessities of the companies and worries more about the programmers that look for a job.
You sign up.
You are assigned a person that will be in charge of you, who will inform you about the most interesting opportunities that comply with the profile which you previously detailed.
You are advised with the utmost respect.
You realize everything is for free for IT profiles and they only charge companies that hire them.
TekkieFinder
“We are the ONLY job portal that PAYS you whenever a company contacts you.” This is what TekkieFinder promises. Do you like the idea?
Is very easy: You register, fill in your profile happily, they get you in their database and, here’s the good stuff, when a company is interested in you, it buys your profile from TekkieFinder to be able contact you, and whether you are interested in the offer or not, you get paid!
There is such a shortage of IT professionals that it is changing the way to take control over them. They are like exotic legendary pokemon hidden behind an ancient glitch. What IT professional wouldn’t be thrilled with this platform?
Circular
Looking for something truly individualized and round? Get in Circular
Circular is similar to the previous employment portal mentioned: Manfred. Although it gives you a less personal feeling than Manfred, among the Spanish platforms, it is the best one in this feature.
Circular, like the dating application Tinder, it gathers companies and applicants all together.
First, you sign up, then a friend of yours/contact within the platform recommends you, since if they do not do it, you will not be able to contact the companies, and that’s it!
GeeksHubs
GeeksHubs is without a doubt one of the best options if you look for an IT job in Spain.
Systems/DevOps, Back-end, Front-end, Mobile, FullStack,… These are some of the categories that you will be able to find in your sector. In addition to enough information on each vacancy, so that it becomes clear whether it interests you or not.
And, in addition, they say how much they are willing to pay you, which is the most interesting part and it is what many hide.
Growara
Growara gets in your shoes and it never offers to its users a project in which they themselves would not work. In fact, it seems that they only work with companies that are actually worth it.
They never ghost you, since they seem to feed on the feedback that you can offer them.
The best thing? They don’t bother spamming you with thousands of offers that do not have anything to do with your professional development. They look for precise and elegant matches that meet your values and capacities.
Tecnoempleo
Tecnoempleo is that portal specialized in computer science, telecommunications and technology that you’re looking for.
More than half a million candidates and 27 thousand companies guarantee its 20 years of professional expertise in the sector.
Although just for having its own mobile app, and specific sections for working abroad or remotely, or looking for your first job, I would choose it hands down.
Primer Empleo
If you are a newbie this is your site, Primer Empleo.
A job portal founded in 2002 and directed specifically to students and recent graduates without labor experience.
So if you have a junior profile and you want to check it out, go ahead. Even if you have not even finished your grade and you are only looking for an internship, it is quite interesting.
Jooble
Jooble and Jooble Mexico are websites that take you to many and a wide range of existing job offers in other pages. Perhaps you lose some time signing up to each one of them, but it may be worth it if you end up getting your way.
It is worth pointing out that, if you get a job thanks to this article, you should treat us to something, even if it’s just a coffee. Always depending on the job you got and its consequent remuneration, of course!
Conclusions
Looking for a job is a task that is already too ungrateful for you to not accept our help through this article and these links. After all, we have been there and we know how lost and frustrated one can feel.
In our blog we have posted a few articles about data centers. We like them. They have grown on us. It is a branch of technology that interests us as much as bitcoin interests brothers-in-law or neighborhood projects interest retirees. For that reason, today, in our blog, we will deal with data management as a service or DMaaS.
Do you already know what DMaaS is and why you need it in your life?
We have talked about it in countless after-dinner conversations with cigars in hand: Data centers are centralized physical facilities used by companies to host their information and applications. Although data centers help us meet the requirements of sending data in real time, there can be problems with outages, and these are an expensive business for companies. On the other hand, the Data center infrastructure management (DCIM) is in charge of monitoring and giving us information about the IT components and facilities of our structure. That includes servers and storage to power distribution units or cooling equipment. The goal of a DCIM initiative is to provide managers with a comprehensive view of data center performance so that power, equipment, and space are used as efficiently as possible. Well, so far we knew everything and we had no rival until the desserts arrived.
However, one might add (while stirring a cup of tea) that today’s data centers are becoming increasingly complex and sophisticated, and as they evolve, they ask for features in DCIM solutions to increase. For that reason, DCIM has to transcend the well-known Cloud and bring its capabilities. So, in order to improve the way data centers operate, Data Management-as-a-Service or DMaaS emerged.
DMaaS, definition and advantages
DMaaS is a type of cloud service that provides companies with centralized storage for different data sources. It enables the optimization of the IT layer by simplifying, monitoring and servicing the physical data center infrastructure for the company.
*Data of vital importance: DMaaS is not DCIM nor a SaaS version of DCIM.
Thanks to the DMaaS service you may analyze large sets of anonymous customer data and improve with machine learning. In no case, I give you my word, will a company using DCIM receive better information than it can get with a DMaaS approach. Not to mention cost savings, downtime reduction and overall performance improvement.
Easy to use and low cost, DMaaS makes it easy for IT professionals to increasingly monitor their data center infrastructure, receiving information in real time and with the additional ability to prevent possible failures as a seer octopus.
Still, in the midst of so much profit, it is very likely that if you were to do a worldwide survey of professionals and entrepreneurs, you would find that cost savings is the most important chosen feature of DMaaS. And it is that, thanks to DMaaS, companies only have to ask their users to register, while informing providers about the specific needs of the organization and the number of registered users. So the provider indeed provides, and manages the infrastructure based on what you have requested.
In a somewhat modest third position among the advantages we would find the protection of a company’s data assets and the additional value obtained from them. As an example, for the data center, DMaaS allows you to maximize hardware security through smart alarms and remote troubleshooting.
One of the main differences to highlight with DCIM is that it is limited to a single data center, while DMaas can help analyze a much larger set, thus providing a more complete view. Furthermore, aside from providing us with analytical insights, the service continually learns and improves based on data collected from users.
Conclusion
Although it is true that we could judge that DMaaS is still in an early stage, work is already being done to solve the main challenges it faces: data encryption, data management functions, data center reduction or performance increase.
At the end of the last century I had the opportunity to help in a very ambitious computer project: the search for radio messages emitted by extraterrestrial civilizations… And what the hell does it have to do with Distributed Systems?
Recently my colleagues wrote an interesting article ondistributed network visibility, which I really liked and I came up with the idea of taking it to the next level. If this post tries to offer full knowledge of the different components in operation within our network, Distributed Systems go “further”; they reach where we lack control over the devices that comprise it.
I am going to exemplify both at the social science level, comparing a union versus a confederation (as a central of workers and unioI am going to exemplify both at the social science level, comparing a union versus a confederation (as a central of workers and unions and not from a political point of view).
*Confederacy
According to Merriam-Webster
1. A group of people, countries, organizations, etc. joined together for a common purpose or by a common interest: LEAGUE, ALLIANCE
Distributed computing, distributed systems, are they the same?
Distributed Systems
If you look for the concept of Distributed Systems on Wikipedia (that magical place), you will be redirected to the article called Distributed Computing and, I quote:
“Distributed computing also refers to the use of distributed systems to solve computational problems. In distributed computing, a problem is divided into many tasks, each of which is solved by one or more computers, which communicate with each other via message passing.”
Without going any further: Wikipedia, if we consider ourselves as computers, it is a very high-level Distributed System, since we comply with its intrinsic characteristics… And what are they?
Features of Distributed Systems
A Distributed System (or Distributed Computing) has:
• Concurrence: Which in the case of computers is a distributed program and in Wikipedia they are people… who use specialized software distributed by web browsers.
• Asynchronous: Each computer (or Wikipedian) works independently without waiting for a result from the other, when it finishes its batch of work, it delivers it and it is taken in and saved.
• Resilience: A computer device that breaks down or loses connection, or a person who dies, withdraws or is expelled from Wikipedia, in both environments does not mean stopping the work or global task. There will always be new resources, machines or humans, ready to join the Distributed System.
The aliens
Right, I started this article talking about them. In today’s -unfortunately- destroyed radio telescope in Arecibo, Puerto Rico, astronomers Carl Sagan and Frank Drake sent a message to the Hercules cluster, a group of galaxies 25,000 light years away from our planet.
That means that it will take 50 thousand years to get an answer, if there is life out there, but what if it is us who were already sent messages thousands or millions of years ago?
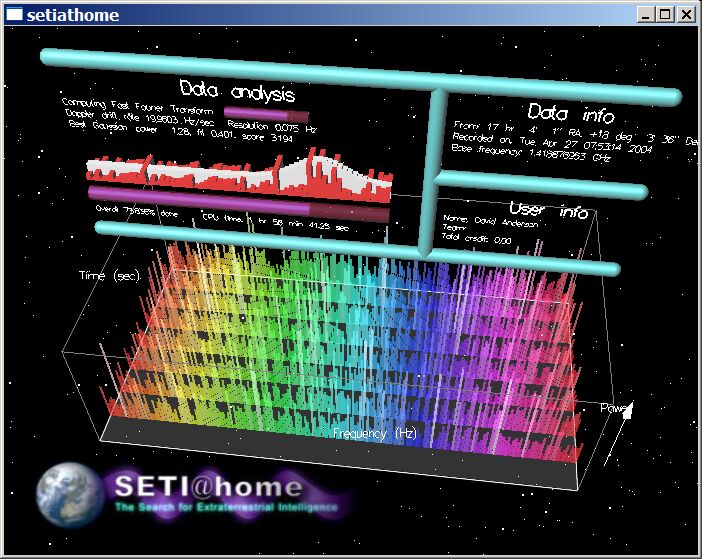
Well, this was the program Seti@home about: it collected radio signals and chopped them into two-minute pieces that were sent to each person who wanted to collaborate in the analysis with their own computer. At the end of the calculation according to a special algorithm, the result was sent and a new piece of code was requested. If a computer after a reasonable time did not return an answer, then the same piece was sent to another computer that wanted to collaborate: the “prize” consisted in publicly recognizing the collaborator as a discoverer of life and intelligence outside this world.
I installed the program and put it as a screensaver, so I calculated while I was working on something else or resting.
“Seti@home (imagen de setiathome.berkeley.edu) ”
There you have it! A distributed system for analyzing the radio signals of the universe!
Distributed monitoring
Distributed monitoring depends on the network topology used, and I bring it up as an introduction or approach to monitoring a distributed system. If you are new to Pandora FMS, I recommend you take some time to read this post.
Essentially it is about distributed environments that give service to a company or organization but do not execute a common software and have very different areas or purposes between departments, supported in communication with a distributed network topology accompanied by a well planned security architecture in monitoring.
Pandora FMS offers in this field service monitoring, very well described in the official documentation.
Observability
It would be an attribute of a system, and the topic is worth a full blog post, but, in summary, I expose observability as a global concept that includes more alert monitoring and alert management activities, visualization and trace analysis for distributed systems, and log analysis.
Companies like Twitter have taken observability very seriously and, as you may have guessed, that addictive social network is a distributed system but with a diffuse end product (increase our knowledge and facts about the real world).
Transaction monitoring
How can we monitor a distributed system if it consists of very heterogeneous components and, as we saw, can reach any part of our known universe?
Pandora FMS has Business Transactional Monitoring, a tool that I consider the most appropriate for distributed systems since we can configure transactions, as many as we need, and then use the necessary transactional agents to do so.
It is a difficult topic to take in but our documentation starts with a simple and practical example, with which, as you experiment, you may add “blocks” of more complex transactions until you reach a point where you can have a panorama of the distributed system.
The question is no longer whether we need distributed systems. That is a fact. Today people use distributed systems in computing services in the cloud or in data centers and the Internet.
Distributed systems can offer impossible functions in monolithic systems or take advantage of computer processes, such as performing restorations from backups by asking other systems for chunks that are missing or have deteriorated in the local system.
For all these cases, and in any case, the flexibility of Pandora FMS will always be useful and adaptable for current or future challenges.
There are different positions on whether observability and monitoring are two sides of the same coin.
We will analyze and explain what the observability of a system is, what it has to do with monitoring and why it is important to understand the differences between the two.
What is observability?
Following the exact definition of the concept of observability, observability is nothing more than the measure that determines how internal states can be inferred through external outputs.
That is, you may guess the status of the system at a given time if you only know the outputs of that system.
But let’s look at it better with an example.
Observability vs monitoring: a practical example
Some say that monitoring provides situational awareness and the capacity for observation (observability) helps determine what is happening and what needs to be done about it.
So what about the root cause analysis that has been provided by monitoring systems for more than a decade?
What about the event correlation that gave us so many headaches?
Both concepts were essentially what observability promises, which is nothing more than adding dimensions to our understanding of the environment. Be able to see (or observe) its complexity as a whole and understand what is happening.
Let’s look at it with an example:
Suppose our business depends on an apple tree. We sell apples, and our tree needs to be healthy.
We can measure the soil pH, humidity, tree temperature and even the existence of bad insects for the plant.
Measuring each of these parameters is monitoring the health of the tree, but individually they are only data, without context, at most with thresholds that delimit what is right or what is wrong.
When we look at that tree, and we also see those metrics on paper, we know that it’s healthy because we have that picture of what a healthy tree is like and we compare it with things that we don’t see.
That is the difference between observing and monitoring.
You may have blood tests, but you will only see a few specific metrics of your blood.
If you have doubts about your health, you will go to a doctor to look at you and help you with the analysis data, do more tests or send you home with a pat on your back.
Monitoring is what nourishes observation.
We’re not talking about a new concept, we’re rediscovering gunpowder.
Although being fair, gunpowder can be a powerful weapon or just used for fireworks.
The path to observability
One of the endemic problems with monitoring is verticality.
Have isolated “silos” of knowledge and technology that barely have contact with each other.
Networks, applications, servers, storage.
Not only do they not have much to do with each other, but sometimes the tools and equipment that handle them are independent.
Returning to our example, it is as if our apple tree were dying and we asked each expert separately:
Our soil expert would tell us it’s okay.
Our insect expert would tell us it’s okay.
Our expert meteorologist would tell us that everything is fine.
Perhaps the worm eating the tree reflected a strange spike in soil pH and it all happened on a day of subtropical storm.
By themselves the data did not trigger the alarms, or if they did, they corrected themselves, but the ensemble of all the signals should have portended something worse.
The first step to achieving observability is to be able to put together metrics from different domains/environments in one place. So you may analyze them, compare them, mix them and interpret them.
Basically what we’ve been saying at Pandora FMS for almost a decade: a single monitoring tool to see it all.
But it’s only the first step, let’s move on.
Is Doctor House wrong when he says everyone is lying?
Or rather, everyone tells what they think they know.
If you ask a server at network level if it’s okay, it will say yes.
If there is no network connectivity and the application is in perfect condition, and you ask at application level whether it is OK, it will tell you that it is OK.
In both cases, no service is provided.
And we’ll say, but how is it okay? it doesn’t work!
Therein lies the reason that observability and monitoring are not the same.
It is processing all the signals what produces a diagnosis and a diagnosis is something that brings much more value than data.
Is it better to observe or monitor?
Wrong.
If you’re asking yourself that question, we haven’t been able to understand each other.
Is it better to go to the doctor or just have an analysis?
It depends on what you’re risking.
If it is important, you should observe with all available data.
If what you’re worried about is something very specific and you know well what you’re talking about, it might be worthwhile to monitor a group of isolated data.Although, are you sure you can afford only to monitor?
Finding the needle in the haystack
Among so many data, with thousands of metrics, the question is how to get relevant information among so many shrouds. Right?
AIOPS, correlation, Big Data, root cause analysis…
Are we looking at another concocted word to sell us more of the same?
It may, but deep down it is a deeper and more meaningful reflection:
What is the use of so much data (Big Data) if I don’t have the capacity for its analysis to be useful to me for something practical?
What good is technology like AIOPS if we can’t have all the data together from all our systems, together and accessible?
Before developing black magic, the ingredients must first be obtained, if not, everything remains in promises and expensive investments that entail wasting time and the unpleasant feeling of having been deceived.
From monitoring to observability
In order to elevate monitoring to the new observability paradigm, we must gather all possible data for analysis.
But how do we get them?
With a monitoring tool.
Yes, a tool like Pandora FMS that can gather all the information together, in one piece, without different parts that make up a Frankenstein that we do not know either what it costs or how it is assembled.
And we’re not talking about a monitoring IKEA, made up of hundreds of pieces that require time and… a lot of time.
This is not new.
Nor is it new that we need a monitoring tool that can collect data from any domain.
For example, switch data, crossed with SAP concurrent user data.
Latency data with session times of a web transaction.
Temperature in Kelvin dancing next to euro cents, positive heartbeats looking closely at the number of slots waiting in a message queue.
LThe only thing that matters is business.
Just the final view.
Observe, understand and above all, resolve that everything is okay, and if it is wrong, know exactly who to call.
What is real observability?
We call it service views.
It is not difficult, we provide tools so that you, who know your business, can identify the critical elements and form a service map that gets feedback from the available information, wherever it comes from.
FMS means for us FLEXIBLE Monitoring System, and it was designed to get information from any system, in any situation, however complex it was and store it to be able to do things with it.
Today our best customers are those who have such a large amount of information that other manufacturers do not know what to do with it.
We don’t know what to do with it either, I won’t fool you, but our customers with our simple technology do.
We help them process it and make sense of it. Make it observable.
We would like to say that we have a kind of magic that others do not, but the truth is that we have no secret.
We take the information from wherever it comes from, whatever it is, and make it available to design service maps.
Some are semi-automatic, but customers who know what to do with it prefer to define very well how to implement them. I insist, they do it themselves, they don’t even ask us for help.
If you want to observe, you need to monitor everything first.
Let’s check out together the features and improvements related to the new Pandora FMS release: Pandora FMS 760.
What’s new in the latest Pandora FMS release, Pandora FMS 760
NEW FEATURES AND IMPROVEMENTS
New histogram graph in modules
Added the ability to display a histogram graph for modules. This graph is exclusive for Boolean modules or for modules that have their criticality thresholds defined, it is very useful to see crash periods.
Alert templates with multiple schedules
The possibility of including several schedules for the execution of both module alerts and events is incorporated. With this new feature, different time slots can be generated within the same day or week, where alerts can be generated.
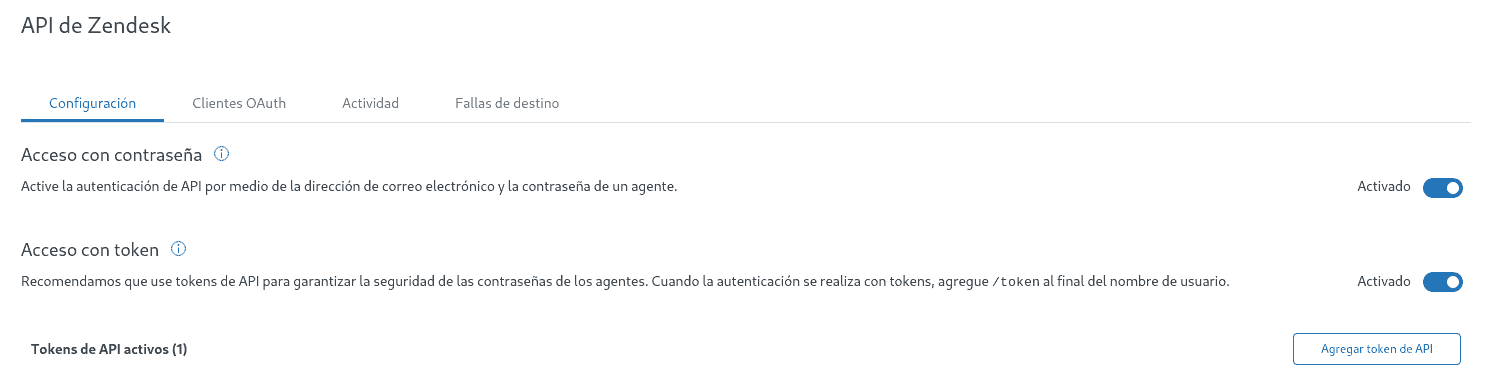
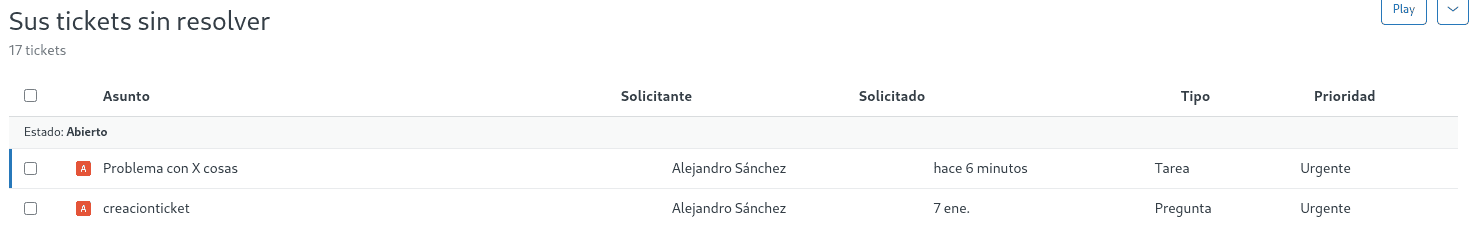
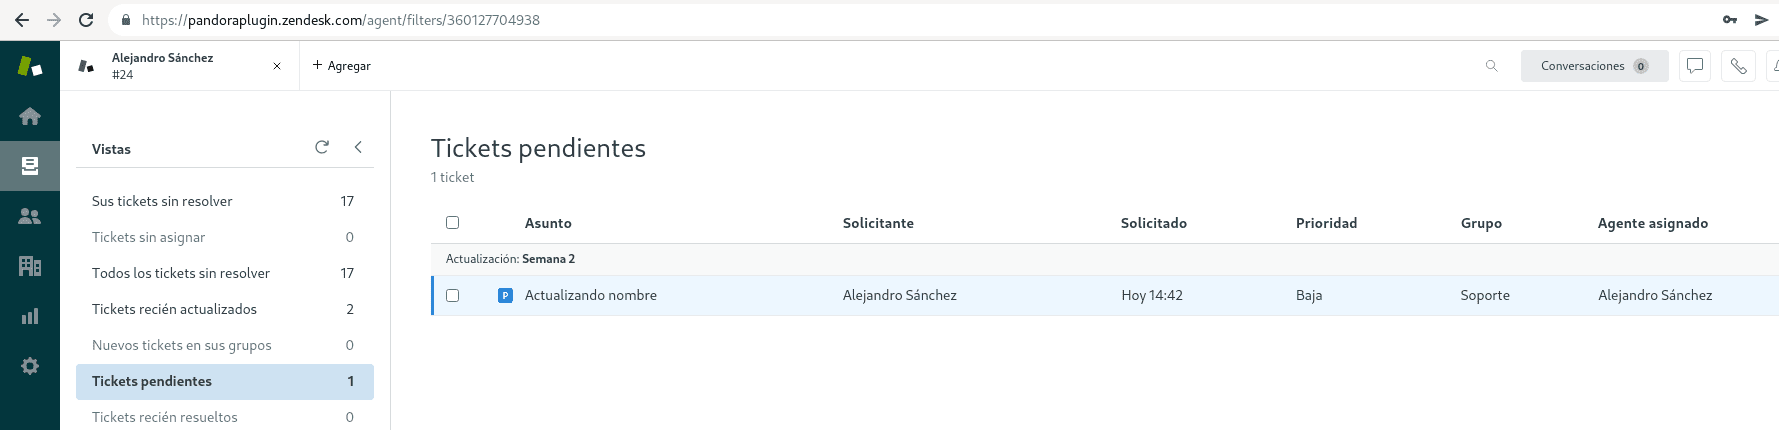
New Zendesk integration plugin
A Zendesk integration plugin has been added to the module library. Thanks to this plugin you may create, update and delete tickets from this system from the terminal or from Pandora FMS.
New inventory plugin for Mac OS X
Just as there were inventory tools for Linux and Windows, you may use this tool to obtain inventory in Mac OS X. You may get information on CPU, Memory, Disks and Software installed on machines of that OS.
New mass deletion section in the Metaconsole
With the latest changes in the process of combination and centralization in the Metaconsole, it was necessary to start including mass operations in it. For now, deleting and editing agents from the Metaconsole have been included.
New internal audit view in the Metaconsole
As part of the continuous improvements to Pandora FMS Metaconsole, the internal audit feature that already existed in the node has been added to supervise the accesses to the Metaconsole, as well as some of the actions carried out from it.
Forcing remote checks on Visual Consoles
In order to carry out a real-time monitoring control in the visual consoles, a button has been generated to be able to force the remote checks that are included in the visual consoles, just as it can be done from the detailed view of a node.
New alert macros
The following alert macros have been added to be able to include more details in the notices:
_time_down_seconds_
_time_down_human_
_warning_threshold_min_
_warning_threshold_max_
_critical_threshold_min_
_critical_threshold_max_
Support for MySQL8 and PHP8
We have included support to be able to use MySQL8 without any type of modification or previous adjustment. We are also preparing the console to work on PHP8 due to the PHP7.4 support time ending on 28th Nov 2022.
Support for OS RHEL 8.x, RockyLinux 8.x, AlmaLinux 8.x
Due to recent changes to what was our base system so far (CentOS), we have decided to use RockyLinux 8 and AlmaLinux 8, as well as continue to support RHEL8 as the base OS. We recommend to all our users who have to migrate from other unsupported Linux versions (such as Centos6) to do so to one of these systems. However, we will continue to provide installers in RPM and Tarball format that can be used to run Pandora FMS on such systems.
KNOWN CHANGES AND LIMITATIONS
New installations using ISO have been removed. From now on, the default installer will be the online installer, which, by means of a single command, prepares and installs the entire system from a Linux RHEL8, Rocky Linux or Alma Linux OS.
Pandora FMS integration with the new plugin library has been improved, in order to use the new plugin library you need to be updated to version 760.
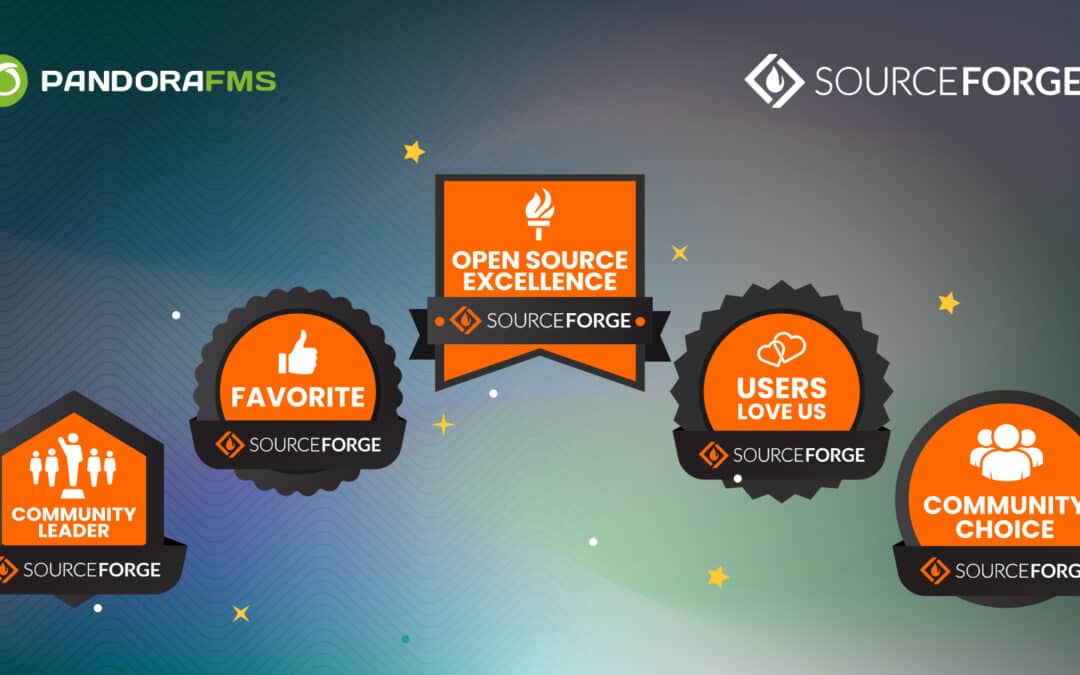
We love uploading this kind of post to our blog. Articles in which we boast about our work and where all the effort of our team throughout the year comes to light. Because yes, we are rewarded once more, Pandora FMS is proclaimed winner in several categories in the SourceForge Awards.
Award in the Community Leader category
Award in the Community Choice category
Award in the Open Source Excellence category
Award in the category Users Love us
SourceForge Favorite
No more and no less than five awards, including the Open Source Excellence 2022 award, possibly one of the most desired and disputed in the industry in this specific sector.
Pandora FMS wins the Open Source Excellence 2022 award
As a message to the world from this podium, we want to make clear that it is an honor to know that these awards are only given to selected projects that have reached significant milestones in terms of downloads and participation within the SourceForge user community.
A great achievement to keep in mind, since Pandora FMS, one of the most complete monitoring software on the market, has been considered for these awards from more than 500,000 open source projects throughout the whole SourceForge platform.
“We are very proud of what our team at Pandora FMS is achieving. An effort of our entire workforce, users and customers that makes Pandora FMS better every day. This award is a recognition of our entire career and shows that Opensource is still alive and that we are one of the leading and pioneering projects in Europe”, states with satisfaction, Sancho Lerena, founder and CEO of Pandora FMS.
SourceForge is an open source software community devoted especially to helping open source projects be as successful as possible. Currently the platform has about 502,000Open Source projects in progress, more than 2.6 milliondownloads per day and a community of 30 million monthly users, who search and develop open source software, and who, from now on, will be able to find the badges achieved by Pandora FMS within its projects page in SourceForge.
As many of you already know, Pandora FMS is a very comprehensive monitoring solution: cost-effective, scalable and covering most infrastructure deployment options. Find and solve problems quickly, no matter if you come from on-premise, multi cloud or a mix of both. A flexible solution that can unify data display for full observability of your organization. With more than 500 plugins available you may control and manage any application and technology, such as SAP, Oracle, Lotus, Citrix, Jboss, VMware, AWS, SQL Server, Redhat, Websphere and a long etc. A flexible tool able to reach everywhere and unify data display to make management easier. Ideal for hybrid environments where technologies, management processes and data are intertwined. And now, moreover, backed and rewarded by the wide expert community of SourceForge.
How have we come so far?
Let’s go back a little. Pandora FMS is licensed under GNU GPL 2.0 and the first line of code was written in 2004 by Sancho Lerena, the company’s current CEO. At that time, free software was in full swing and the Free Software Foundation in Spain had an active group of which Sancho was a part.
In those days there was no Github, but there was something that united us all: SourceForge. From the beginning of the current century this platform served to unify and enhance thousands of developers who wanted to share their creations with users around the world. Pandora FMS was there from its inception in 2004, although initially it was not called that, but “Pandoramon.”
*If you are curious about our beginnings, you may readthis article about our history.
As of this date, there are several thousand free version users who download Pandora FMS updates through their update system and use it daily.
Pandora FMS has been uploading every release with its corresponding source file for over 18 years, every day to its Sourceforge project and we are very proud to say that not only do we continue to believe in it, but we have not stopped doing so in almost twenty years of history.
Beyond code, we believe in the power of community, sharing, and growing together. That is why we maintain a very extensive documentation of more than 1000 pages in four languages: Spanish, English, French and Russian.
Our community website includes a system of forums, an extensive knowledge base with more than 500 articles and a blog with more than 1,900 articles translated into four languages.
Of course, we also offer a wide range of professional services and commercial versions of our software. But, as Stallman himself said:
“Free software” means software that respects users’ freedom and community. Roughly, it means that the users have the freedom to run, copy, distribute, study, change and improve the software. Thus, “free software” is a matter of liberty, not price. To understand the concept, you should think of “free” as in “free speech,” not as in “free beer.”
Now yes, after all that has been said, we invite you to check that freedom is much more than a slogan. Thank you again for this award. And don’t take too long, join us!
Do you already know what tasks the QA department performs? Would you like to discover what each QA tester does on a daily basis? You don’t know what the hell we’re talking about but you’re intrigued and can’t stop reading because my prose is enigmatic and addictive? Well, you’ve come to the right place! We’ll tell you how our QA department manages so you can learn what yours does without having to ask. Read on and don’t forget to propose me for the Nobel Prize for literature when the time comes!
Do you already know what tasks the QA department performs?
Starting with the functions of the department, QA is in charge of testing Pandora FMS and making sure that we offer the best possible quality to our clients and the community. It is an extremely complex task because Pandora FMS is very large and it could be said that chaos theory is well applied, since inserting an “&” character in a form field can cause a report that had nothing to do with it to fail. So be careful, any day your building could burn for the wrong character! From Pandora FMS we recommend hiring only professionals
Currently, our QA team is made up of Daniel Ródriguez, Manuel Montes and Diego Muñoz, although from time to time, colleagues from other departments support them to carry out specific tests. They are thick as thieves. They always sit together at company dinners and share a bottle of Beefeater after dinner.
QA Tester Team
Daniel Rodríguez, “The beast (QA) of Metal”
Works together with the Support and Development Departments. He is devoted to testing new features and finding possible bugs to help improve the product. He loves sci-fi movies and metal:
“My duties as department head are mainly to manage and supervise the work of the department, design and improve test plans, carry out manual tests and coordinate communication with the rest of the departments.”
Manuel Montes
is from Madrid and began as part of the Development department, although he later joined the QA team. He loves cycling when the weather allows it, watching movies, reading and going for a walk with his family
“In addition to manual tests, we carry out automatic tests with technologies such as Selenium Webdriver and Java to interact with the browser, Cucumber with Gherkin language so that the tests to be carried out are somewhat more understandable for less technical colleagues and, in turn, serve as documentation, and Allure to generate reports with the results of said tests.”
Diego Muñoz, “The Gamer Alchemist”
is a QA tester, although he also helps the Support team, solving different problems for customers. He is from Huelva and although he has lived there all his life, he has no accent, which he boasts about. His hobbies range from watching movies, to video games, listening to music and watching series:
“Every piece of code that is implemented in Pandora FMS goes through my hands or through those of one of my colleagues, who judge if the changes work correctly or have any errors. We also sometimes suggest alternative ways to present features to developers or to solve the bugs that we have been able to find. In addition, in the days prior to the product release, we review the whole console in all its Metaconsole, Node and Open variants, once again making sure that the code introduced in the new version works as well as possible.”
The importance of the QA department
From the QA department, an average of180 tickets are generated per release and, as you know, we present 10 releases a year. This adds up to more than 1,800 tickets annually, how cool is that? Sometimes it is a heinous job, because it involves throwing back the work of a Development colleague, and also difficult because it is impossible to see everything, and when a problem explodes in a client’s environment, it attracts all eyes. Although QA work has little visibility and can be very thankless, it is fundamental to the success of everyone’s work and the final product.
If you want to find out more about our departments out of curiosity or for the simple fact that this way you can find out more about yours, you can request it in the comments box, one of our busy social networks or by post, which is a little bit outdated but should totally come back. Scented letters and vermilion sealing wax. There can’t be anything more romantic!
Three funny facts that you may not have known: 1) Elvis Presley and Johnny Cash were colleagues. 2) Jean-Claude Van Damme was Chuck Norris’s security staff. 3) Pandora FMS has a plugin for WordPress. That’s right! Pandora FMS has a monitoring plugin for WordPress that has been totally renewed and prepared for you! Get to know Pandora FMS WP!
Get to know Pandora FMS WP, our plugin for WordPress
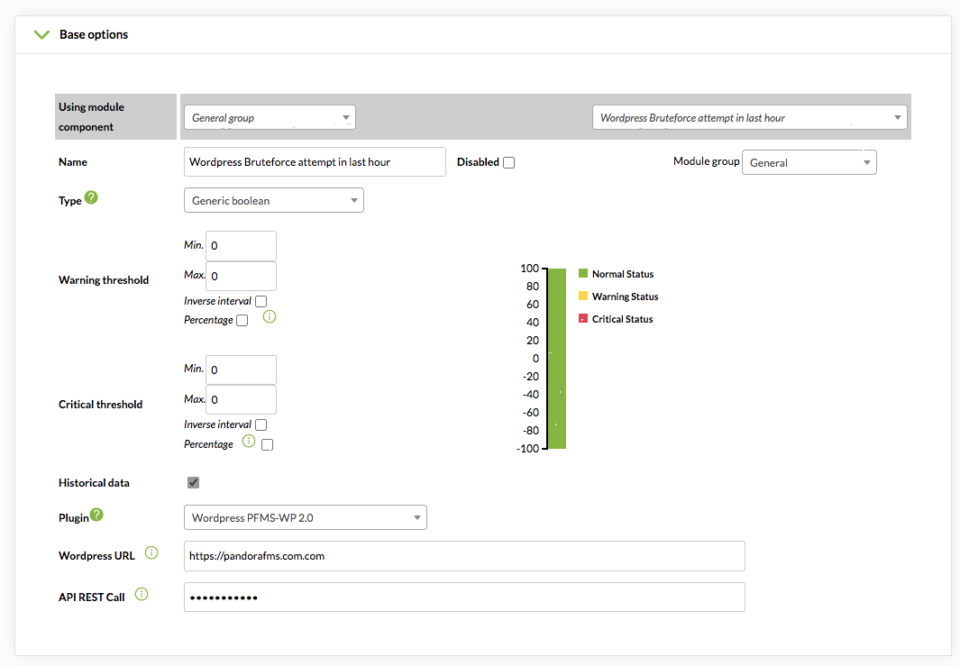
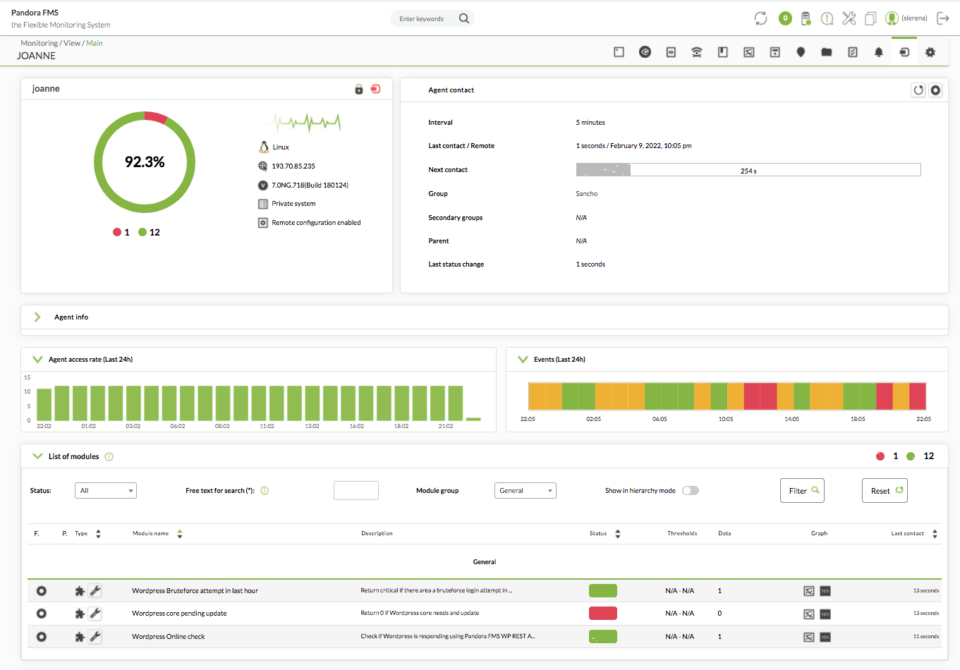
100% free and OpenSource Pandora FMS WP arrives, a monitoring plugin for WordPress. What is it for? Collect basic information from your WordPress and allow Pandora FMS to retrieve it remotely through a REST API.
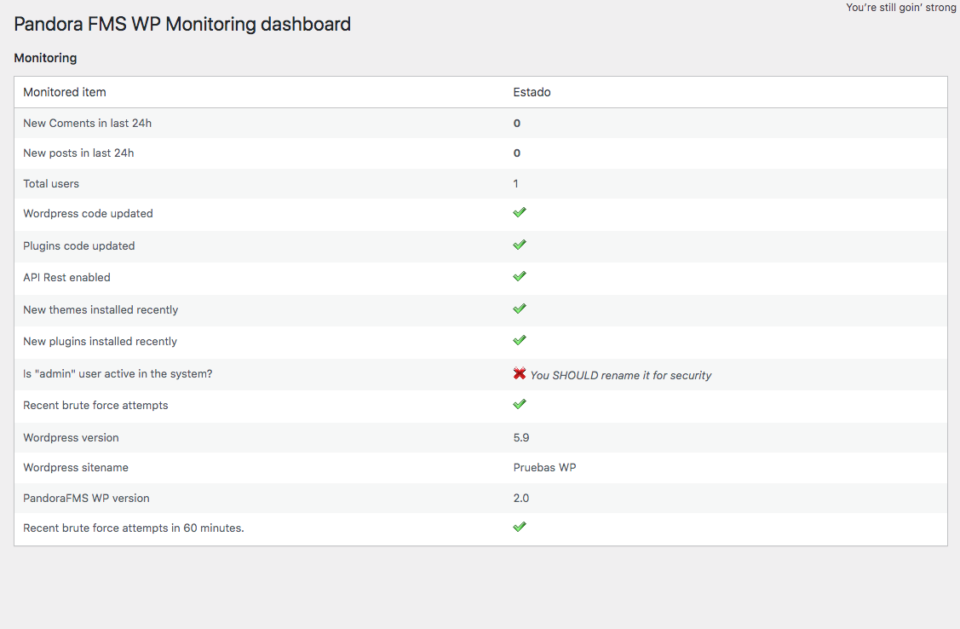
Some examples of basic information you might collect: new posts, comments from followers, or user logins in the last hour. At the same time, it also monitors whether new plugins or themes have been installed, if a new user has been created or if a login attempt has been made by brute force.
Also, if desired, it can be easily extended by defining custom SQL queries to monitor other plugins or create your own SQL to collect information and send it to Pandora FMS.
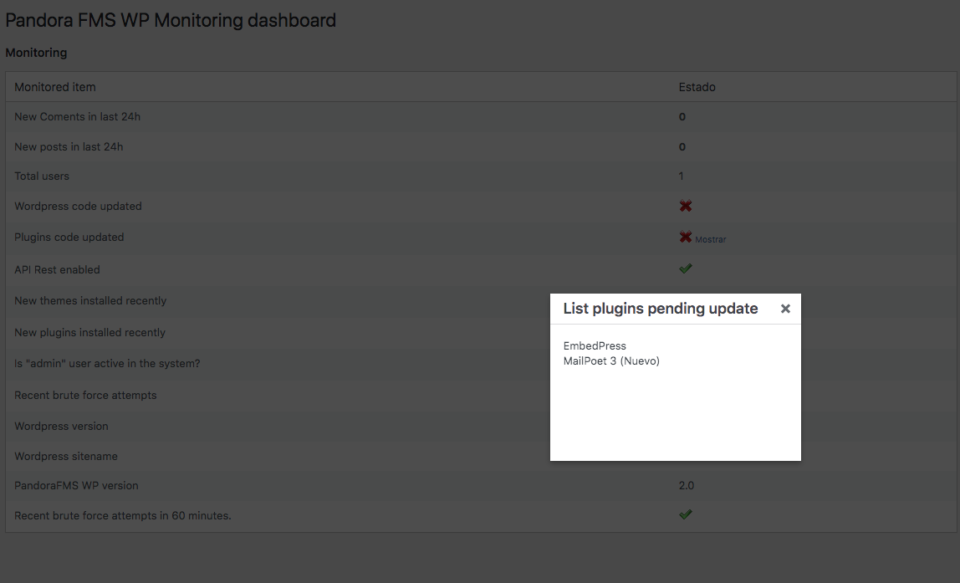
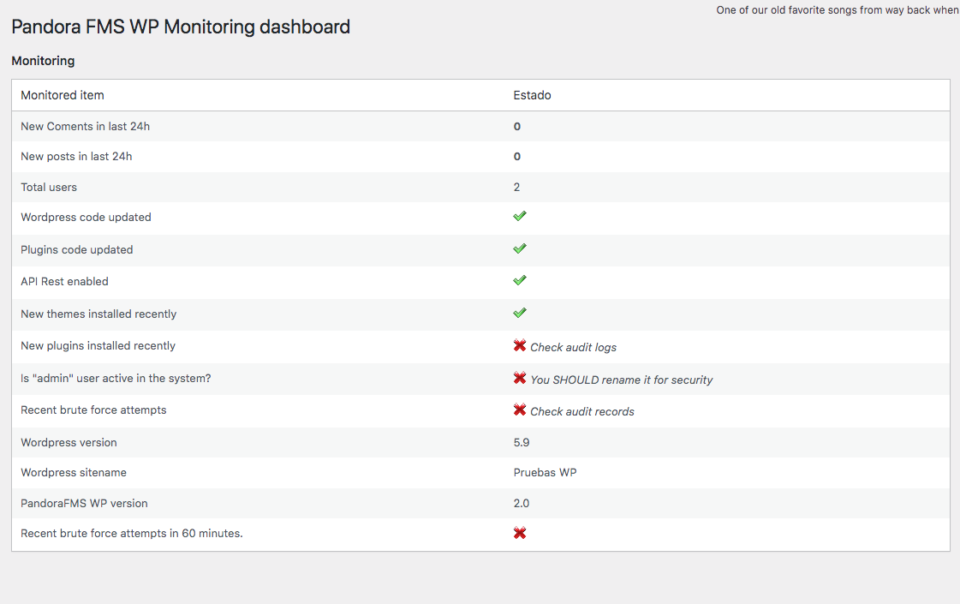
This is where you may see a detailed summary of the monitored elements. You know, updated plugins, WP version and whether they need to be updated, total number of users, new posts in the last 24 hours, new answers also in the last 24 hours… and other similar checks.
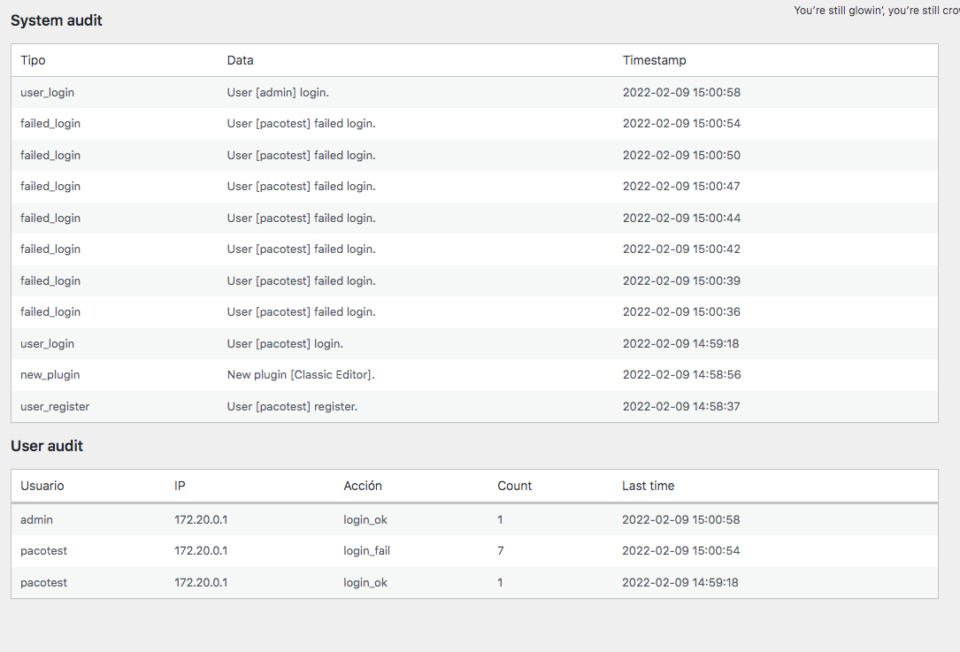
Audit records
Here a table will be displayed before you with the access data of the users, IP, whether the login has been correct or incorrect and how many times, the date of the last access… You will also be able to check whether new plugins or themes have been installed, and the date these changes took place.
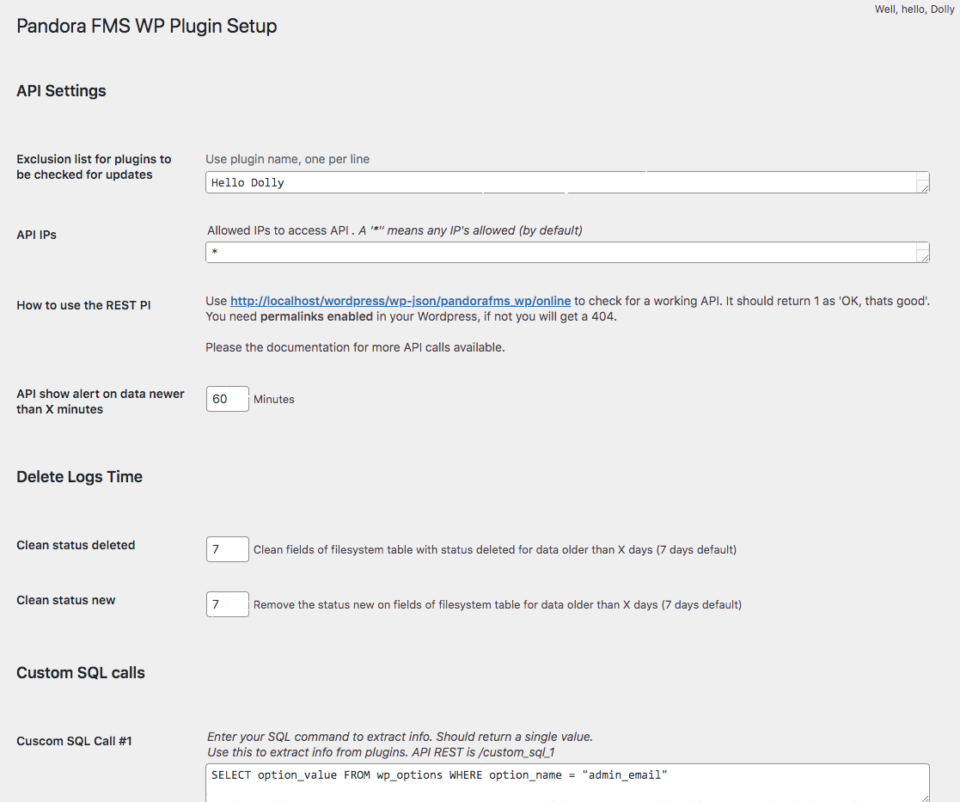
General Setup
Here you may configure the general options:
Configuration of the API
List of IPs with access to the API
Set the time to display new data in the API
Log deletion time
Clean fields of table filesystem with deleted status on data older than X days
Delete the status “new”from the filesystem table fields in data older than X days
Custom SQL queries
Prerequisites
Pandora FMS WP optionally requires a plugin for the REST API, called “JSON REST API”. It is only necessary if you want to integrate the monitoring/status information of the WP in a central management console with Pandora FMS. As we have already pointed out, this is an optional feature, you may manage all the information from WordPress itself.
If your WordPress version is below 4.7, you must have the WP REST API (v2) plugin installed in order to use the API.
Some limitations
WP Multisiteis not supported in this version.
To use WordPress REST API, you need version 4.6 or higher.
Some cool screenshots
So that you may get an idea of the brand new aspect of the plugin, we leave you a couple of screenshots as an appetizer.
2022, the world is the technological paradise you always dreamed of. Space mining, smart cities, 3D printers to make your own Darth Vader mask… Just a little problem, society is based on digitization and communications and you have no idea about the visibility of distributed networks. Something of vital importance considering the rise of cybercrime. Well, don’t worry, we’ll help you.
Do you know everything about distributed network visibility?
Well, the first thing you need to be aware of is the importance of this distributed network visibility. After all, companies around the globe say that the biggest blind spots in their security come from the network, so all their efforts are focused on safeguarding their data by reinforcing this trench. That’s why visibility is key. Even more so if we talk about Managed Service Providers (MSP), the professionals in charge of protecting customer data.
But, what is distributed network visibility?
To put it simply, distributed network visibility supposes having full knowledge of the different components running within your network to be able to analyze, at will, aspects such as traffic, performance, applications, managed resources and many more, which will depend on the capabilities offered by your monitoring tool. In addition to increasing visibility into your customers’ networks, a comprehensive solution can give you more leverage to strategize based on the metrics you’re monitoring.
For example, MSPs can, with a good visibility solution, help improve the security of their customers by revealing signs of network danger or, through better analytics, make more informed and rigorous decisions about data protection.
As we have warned before, cybercrime is our daily bread in this almost science fiction future that we have earned, and blind spots in network security, along with what will become of the cd, is one of our great concerns.
Monitor traffic, look for performance bottlenecks, provide visibility thanks to a good monitoring tool and alert on irregular performance… That’s what we need. In addition, these super important alerts draw attention and notify technicians and system administrators, who will immediately take the appropriate measures to solve our problem.
If you are an MSP in this post-apocalyptic future that we are living in, it is very likely that you use several applications as part of your services, well, another of the obvious advantages of improved visibility is the ability to participate in application supervision. So, for example, when granular network visibility is set, you may get unquestionable insight into how applications are affecting performance and connectivity. Once you are aware of this, you may choose to filter critical app traffic to the right tools and monitor who is using which app and when. You may even make application performance more practical, reducing processor and bandwidth work by ensuring, for example, that email traffic is not sent to non-email gateways.
Some challenges to consider
Not everything is having fun and joking around, rolling on the carpet and having crises saved by your expertise, there are several challenges for MSPs associated with network visibility.
Cloud computing has increased and mobile traffic has increased too, this only adds, to our inconvenience capacity, more blind spots to watch out for as MSP. The end has come for the magnanimous and bucolic days of lying on the grass simply monitoring traffic over MPLS links. We are in the future, and WANs are a deadlock for Internet-based VPNs, Cloud services, MPLS, and mobile users. Something complex that many rudimentary monitoring tools cannot offer full visibility of. There are many components to address. To deal with this Gordian knot and its dense complexity, MSPs must be demanding and rigorous when choosing a monitoring tool to work with.
Another of the great challenges that MSPs may face in this field is the fact that the most traditional monitoring methods are closely linked to on-premise devices. This means that all WAN locations need their own set of applications, and these must have their own sources and be properly maintained. Optionally, all traffic can be retrieved and inspected from a WAN location. This inefficient method can have a performance impact.
Due to this inefficiency, it becomes difficult to apply the traditional approach to distributed network visibility. For enterprises with many applications, networking becomes too obtuse and convoluted, with a variety of individual configurations and policies difficult to support. Additionally, there is the capacity restrictions of the devices, which limit the amount of traffic that can be analyzed without the need to update the hardware. This without noticing that at some point the devices will have to be completely patched or replaced. Damn, even if your company grows, which is what we want, network visibility will quickly be constrained and more security vulnerabilities will go unnoticed.
Conclusions and good wishes
I gave you a very bad prospect. But don’t worry, it was only an adverse in crescendo until reaching the great catharsis: While there are many traditional monitoring tools that cannot address distributed network visibility challenges, there are, thank heavens, other monitoring tools that can. This is the example of Pandora FMS, a monitoring software that is up to the challenges such as those raised and that helps technicians manage complex networks and much more. Pandora FMS allows you to control, manage and customize the tool through a centralized interface. Thanks to its scalability you will be able to manage networks with hundreds of devices and give IT providers what they need to increase security and maximize efficiency. You don’t believe it? Try it now for 30 days for free. You see, not everything was going to be bad in this post apocalyptic future!
In our daily life we can face different difficulties. From spilling coffee on our clean shirt just before leaving home to not finding an emoji that satisfies us to answer that someone we like. Stupid little things compared to how difficult it is sometimes to identify network problems for an external IT provider.
Steps to identify network problems
As we pointed out, finding network problems is, due to its transient nature, a hassle. And IT vendors often have to stay on site to monitor firsthand for signs that often signal network problems. This is not cool at all. Being able to monitor network devices or cloud services from a remote location should be part of our rights, something fundamental in the life of someone who wants to be a good Managed Service Provider (MSP). For this reason, we wanted, from our blog, to help these poor people with a list of steps to identify network problems. We are that kind and philanthropic. Take note!
One: Supervise, supervise and supervise
Today we know that there are many tools that help MSPs to monitor servers and others, but today’s networks are something much more complex and difficult to deal with. In the past, you had to make do with simple routers or switches, but now you can monitor with the help of all kinds of IoT devices, cameras, VoIP phones/systems, etc. There is no reason to complain. Make use of all of them to carry out your supervision work. Manage with a good monitoring tool from routine ping tests to the most complicated SNMP queries. With the right weapons, professionals can do their job remotely, taking advantage of the information provided by network devices.
Two: Pay attention to the Cloud
We have mentioned it more than once in this blog, the Cloud has become of key importance for companies, whether they are small or large. Adopting more services based on the cloud for the functions that are vital to your business. The bad thing? Sometimes the Internet speed is not the ideal one we would like, and there are even interruptions in our services. Usually the IT provider is advised to diagnose and bring the problem to light. However, without accurate historical data to verify what was happening at the time the outage occurred, it is very difficult for the technician to make a good diagnosis.
With Pandora FMS, for example, by constantly monitoring the connection between your clients’ devices and your services in the Cloud and creating, in turn, a collection of historical data that you could return to in the event of a failure, you wouldn’t have that problem.
And three: Go for the unusual
You should investigate any unusual activity on your devices like a police sleuth, because it could mean a potential security risk, even when segmented into your own VLAN or physical network.
Network monitoring is an indispensable part of any IT provider tool. Troubleshooting, proactive monitoring, security… Efficiency and responsibility can help you earn money, or at least help you save it, thanks to this additional service.
It will never be “We have to keep an eye on this until it happens again”. With a good monitoring tool, you will have the data at hand to determine what happened, why it happened and what the steps should be now so that it does not happen again. Because as we’ve seen, network problems can be harder to find than a sober intern at a company dinner, but with the right tools, you can get enough help to get by on your feet.
Conclusions:
If there are any conclusions to be drawn from this article, they are:
Change your shirt, quickly, by one that has not been stained with coffee before leaving the house.
All emojis are good if she, or he, likes you too. Well, except for the one with the poo. That emoji is hideous!
Incorporating Pandora FMS to your team can help you do your job more efficiently and for your clients’ networks to be always safe. Take a look at our website or enjoy right away a FREE TRIAL for 30 days of Pandora FMS Enterprise. Get it here!
Whether you are a DIY ace or a master at roast beef, a decorated luthier or the best seamstress in the neighborhood, we all love to work with good tools, right? This includes, of course, good IT professionals. Because IT monitoring tools are fundamental when it comes to supervising a network infrastructure and applying the corresponding policies and security measures. Even so, not every monitoring tool is perfect, in fact some could even get to the point of harming us. Let’s take a look!
Better monitoring tools, better monitoring
It’s instinctively basic: you have to find the right monitoring tool for each job. Indeed, although it may seem unheard of, it is quite difficult for IT teams to find comprehensive and outstanding monitoring tools. Some of them are too specialized or do not support all applications because they might lack certain features. This dilemma can lead IT teams to use hundreds of disparate monitoring tools, due to the need to attend to all monitoring tasks. I know what you are thinking: “That must be expensive”. Yes, it is, plus it slows down the working pace due to the huge amount of reports, each with their own features, to be inspected and checked.
That is why we must avoid tool proliferation, as we avoid the proliferation of gremlins or herniated discs. Preventing it through individual monitoring solutions, even if this requires significant changes, such as the implementation of integrated tools, conceived to support multiple applications, or special network configurations.
The most efficient thing would be to go for IT monitoring tools that include updates to support today’s most respected applications and provide IT administrators with a single management board.
Simplifying is the key
If you have to choose a monitoring platform, you should be aware beforehand that different IT sectors require different types of solutions. Try, with a single solution, to address as many sections as possible, thus adding further depth to monitoring activities. Such a single solution will give you a greater ability to automate responses and locate irregular events in any system you are monitoring.
For this reason, IT departments often look for a suite of fully integrated IT tools offered by centralized system management and monitoring companies. These companies often promise to reduce the license and maintenance costs of their software, as well as the use of their monitoring tool integrated in the corresponding environment to help manage the company.
The IT department will reduce costs thanks to these integrated tools, among other things because they already have a strong response to any problem that may arise. In fact, one of the direct benefits is the reduction of incidents that require the action of the support teams. Also general performance visibility and system availability, thus increasing the total productivity of the company.
But hold on there, before you go running to look for a monitoring tool that suits your company’s requirements and even your zodiac sign, it is TOTALLY NECESSARY to define what justifies monitoring in your company. Remember that each piece of your IT department will have something to say and contribute, there are different features regarding each function, information flow and security clauses. Once you have a full and clear idea of what you and your company need, you may start with a good monitoring strategy.
Application monitoring tools
Application monitoring is, broadly speaking, monitoring activity logs to see how applications are being used. You know, looking at the access roles of the users, the data that is accessed, how this data is used… If your monitoring tool is good, it even shows a window to the log data and an exhaustive view of all the data elements that make up a healthy application: response times, data traces…
Any self-respecting application monitoring tool has to offer these kinds of features, as well as being integrated with database and network monitoring. Thus, together, they will be able to improve application response times through active and immediate solutions to performance problems that arise.
Network monitoring tools
DNS host monitoring, IP address management, packet tracking… This is more or less what all network monitoring tools usually offer. They usually fall short, however, when it comes to supervising everything related to network traffic, whether internally or externally. What they should always provide, under oath, is full surveillance of all devices connected to the network.
Compliance control monitoring
Don’t worry, if you haven’t yet managed to justify implementing a full monitoring tool, compliance monitoring will make up your mind.
Compliance monitoring solutions will provide you with templates based on types of regulations, allowing you to conveniently design and implement a comprehensive compliance monitoring strategy, including the ability to monitor log data, in real time, from any type of device connected to your network, including routers and switches.
Thanks to compliance control monitoring tools you will be able to collect, correlate and export any necessary registration information for the IT team. Report templates will be able to align with formats common to regulatory agencies. In addition to providing exhaustive analysis in the case of internal audits.
Conclusions
If we have made something clear today, it is that the system management and monitoring solution you choose must meet a small series of requirements: be integrated into several systems, be accessible to the IT team through an intuitive interface based on a control panel, be scalable, and stay constantly evolving so that its ability to help you maintain your services can go forward and transcend when you need it.
If doubt and anxiety overcome you, do not worry, what you are looking for is not far away. Pandora FMS is capable of monitoring all these IT areas that we talked about and much more. Thanks to its more than 16 features and more than 500 Enterprise plugins available. Also, if you are not very knowledgeable in this matter, do not worry, we manage it for you with our MaaS solution. Try it now, for 30 days, for free!
Al momento de escribir estas líneas, prácticamente todo lo que conectamos a nuestros dispositivos es mediante el llamado Universal Serial Bus (USB): cámaras, micrófonos, almacenamiento externo… ¡Es la manera más rápida y segura de sincronizar y respaldar información entre nuestro teléfono móvil y ordenador! ¿Pero qué tiene todo esto que ver con el Windows Subsystem for Linux (WSL2 Ubuntu)? Veamos.
Estudio en WSL2 con Ubuntu: software privativo y libre
De entrada, os dejo un enlace a un artículo publicado en este blog, para así facilitar el conocimiento de la tecnología que iré nombrando. Agregaré más de ellos a lo largo del texto. Tenemos bastante tela que cortar, así que recomiendo una buena y humeante taza de café negro en vuestras manos antes de empezar.
Siempre afirmo que «para saber a dónde vamos, necesitamos saber de dónde venimos». Desde 1989 yo he trabajado con los productos que vende la empresa Microsoft Corporation: primero el sistema operativo MS-DOS y su única forma de interacción por línea de comandos y, luego, Microsoft Windows, el cual utiliza, además, el entorno gráfico. Sí, lo sé bien, el MS-DOS® como tal fue eliminado, pero aún quedan sus comandos. Fue sustituido con Powershell®, del cual ya hemos hemos hablado, y es importante para el tema de hoy.
Acabando 2016, Microsoft nos sorprendió con la noticia de que su SQL Server® podía ser ejecutado sobre GNU/Linux. Para mí, que durante muchos años trabajé instalando y manteniendo servidores de datos para mis clientes, fue una noticia impactante. Pero esperad, aún hay más, en mi periplo, descubrí que el BASHwarepuede afectar a un sistema Windows por medio del WSL. Lo que nos lleva al artículo de hoy, donde entraremos en el manejo de los dispositivos USB, con particular atención a micrófonos y cámaras web, bajo WSL2 con Ubuntu 20.04.
WSL y WSL2
Recomiendo, de nuevo, el excelente artículo sobre WSL2. Aunque el tiempo ha transcurrido y existen algunos cambios significativos. En aquella oportunidad el WSL2 se instalaba por medio de comandos. Ahora, y quiero recalcarlo, noto que por el Panel de Control de MS Windows, «Programas y características», podemos agregar los dos componentes claves que son Virtual Machine Platform y, obviamente, Windows Subsystem for Linux en el apartado de «Activar o desactivar características de Windows»:
Después de esto se debe reiniciar el sistema operativo, ¡esto es ya idiosincrasia de la casa de Redmond! (Después vendrán muchos reinicios más que dejaré fuera. Estarán implícitos).
Otro aspecto que fue agregado en julio de 2021 es la posibilidad de agregar las distribuciones Linux que uno desee, directamente, por la línea de comandos en Powershell (dependiendo de la versión y tipo de MS Windows que tengáis instalado).
Para ver las distribuciones disponibles:
wsl --list --online
Para instalar Ubuntu 20.04:
wsl --install -d Ubuntu-20.04
Después de cierto tiempo, dependiendo de la velocidad de descarga de Internet, preguntará por nombre de usuario y contraseña. Inmediatamente mostrará el estado de las actualizaciones para Ubuntu.
Para configurar WSL2 como predeterminada:
wsl --set-default-version 2
La opción de descargar y usar desde la Microsoft Store sigue siendo válida y disponible, para Ubuntu 20.04 ocupa casi medio gigabyte de espacio.
La diferencia fundamental entre WSL y WSL2 es que la última descarga es un kernel completo de Linux, pero no un kernel cualquiera, es uno especialmente diseñado para que se acople con el kernel de Windows. Esto quiere decir que las aplicaciones ejecutadas en WSL2 siempre deberán ser «pasadas» -mas no interpretadas, como era en WSL- antes de interactuar con cualquier hardware, USB incluído.
En lo único que WSL supera a WSL2 es el intercambio de ficheros entre los dos sistemas operativos. El resto son todo ventajas y mejoras en WSL2.
Podman en WSL2
Para que os hagáis una idea de lo útil que es incluir un kernel completo de Linux en MS Windows, el software Podman (sucesor de Docker), puede ser ejecutado sobre WSL2. Si aún no sabéis lo que es Podman, haced más café y visitad otro de nuestros artículos.
Modo de desarrollador
Una característica que ofrece Powershell y que podemos usar a nuestro favor, una vez hayamos instalado y configurado WSL2, es el modo de desarrollador. Se accede pulsando la tecla de inicio de Windows, tecleando «Powershell» y escogiendo la configuración de desarrollador. Lo primero es activar el modo de desarrollador y esperar a que se termine de instalar el software necesario.
Este consta de dos componentes principales:
Device Portal.
Device Discovery.
El Device Portal abrirá el puerto 50080 (recordad configurar debidamente el Windows Defender Firewall), y desde cualquier navegador web podremos introducir las credenciales configuradas y acceder a una variedad de aspectos que podréis observar en la siguiente imagen.
*Hay un tutorial para establecer conexiones seguras con HTTPS pero no viene al caso para este artículo:
Guardando las distancias, esto es parecido a lo que ofrece eHorus para una monitorización tanto básica como avanzada, si es utilizado en conjunto con Pandora FMS. He incluído esta característica porque las credenciales configuradas son necesarias para el siguiente punto.
El segundo componente es el Device Discovery que, entre otros aspectos, abrirá un servidor SSH para realizar conexión.
Esto permite abrir una terminal con la línea de comandos de Windows y, una vez allí, podremos utilizar directamente WSL2 para cualquier tarea que necesitemos desarrollar de manera remota desde otro equipo. En este caso, de ejemplo he utilizado el software PuTTY para conectar desde la máquina real a la máquina virtual Windows 10 con WSL2 instalado y configurado:
Como veis, una vez se ha establecido la configuración por defecto, solo con escribir el comando wsl estaremos listos en un ambiente Linux, no GNU/Linux sino MSW/Linux.
USB en WSL2
Llegamos al propósito de esta entrada en el blog: el manejo de USB en WSL2. Al momento de redactar estas líneas, hay dos noticias, una mala y otra buena.
La mala noticia es que no, por ahora WSL2 es incapaz de ofrecer soporte para USB, así que, por ejemplo, vuestras cámaras y micrófonos conectados por esta vía no estarán disponibles para ser utilizados desde WSL2.
La buena noticia es que podemos compilar nuestro propio kernel Linux para WSL2 y tener acceso a algún que otro micrófono o cámara web desde nuestra distribución Linux elegida. ¿Pero qué aplicaciones podríamos usar para ello?
Compilando kernel Linux para WSL2
Antes de hacer cualquier cosa, primero debemos actualizar Ubuntu WSL2 con los comandos de siempre:
$ sudo apt update
$ sudo apt upgrade
Y si creían que con esto era suficiente descarga de software… pues no, ahora se debe instalar lo que yo llamo el entorno de programación (dependencias):
Son tres gigabytes a descargar. El código fuente. Brutal. Aunque siempre se puede usar el parámetro git clone -depth=1 <repositorio> , esa opción no la utilicé. Recomiendo al menos 100 gigabytes libres en almacenamiento antes de entrar a la carpeta descargada (repositorio clonado) y ejecutar:
$ make -d KCONFIG_CONFIG=Microsoft/config-wsl
En este punto debo aclarar que encontré muchas opciones de configuración para compilar. Por ejemplo, para instalar el software de manejo de paquetes Snap sobre Debian. Ahora bien, todo esto está excluido del soporte de Microsoft, nada podréis reclamar a esta empresa si algo sale mal en el proceso de compilación.
Para finalizar deberemos apagar WSL2 con el comando wsl –shutdown y copiar el kernel recién compilado en la siguiente vía no sin antes respaldar el kernel original:
C:\Windows\System32\lxss\tools\kernel
A esta altura ya deberíamos poder conectar cualquier micrófono o cámara web y tener acceso desde WSL2… Pero va a ser que no. Resulta que primero debemos conseguir los controladores de hardware para MS Windows, obvio, y luego los de Linux, meterlos en el código fuente estos últimos y volver a compilar de nuevo. Además a eso le sumamos instalar en Ubuntu WSL2:
Y de paso también se debe instalar del lado de Windows, con un paquete instalador MSI, el proyecto USBIPD-WIN…
Como podemos observar, ya que nos hemos mal acostumbrado a la sencillez gráfica de Windows, si deshabilitamos el USB por el Administrador de dispositivos ningún hardware podrá conectarse con o sin nuestro consentimiento, ya que estará bloqueado a nivel de sistema operativo.
Instalando aplicaciones gráficas en WSL2
Para finalizar, aunque en el caso del instalador de paquetes snap está explícitamente sin soporte alguno en Ubuntu sobre WSL2, otras aplicaciones que interactúan con hardware (como el sonido, por ejemplo), podrán ser instaladas, pero cuando intenten acceder a los ficheros de hardware (recordar que en Linux todo es un fichero) pues sencillamente no encontrarán tales recursos. Es el caso del software espeak:
En teoría, en el blog de Ubuntu se indica que por medio de X Window System Architecture se puede «pasar» la interfaz gráfica de las aplicaciones instaladas en WLS2. Oficialmente Microsoft anunció justo antes de terminar el año 2021 que las siguientes aplicaciones gráficas se pueden ejecutar:
Gedit (mi editor de texto GNU gráfico favorito).
GIMP (potente para diseño gráfico).
Nautilus (explorador de archivos).
VLC (reproductor de audio y vídeo).
Aplicaciones basadas en X11 (calculadora, reloj, etcétera).
Google Chrome (bajo vuestro propio riesgo debido a su gran consumo de RAM y recursos).
Pero esto tiene algunos inconvenientes. Primero, se debe tener Windows 11 Build 22000. Segundo, tener instalados los controladores de hardware de vídeo para WSL2. Tercero, estar inscrito en el programa Windows Insider. ¡Espero os haya gustado la información!
Somos unos drogodependientes. No del verde cannabis o del MDMA, necesariamente, pero sí de algunos elementos esparcidos por el globo que sustentan la base de la economía mundial y que necesitamos, como agua de mayo, para que todo siga en orden. La escasez de chips de silicio ya es uno de los problemas más asfixiantes a los que la humanidad se tiene que enfrentar en estos tiempos, te lo contamos en este artículo.
Un nuevo problema mundial: La escasez de chips de silicio
Quizá hubo algún espabilado que lo supo antes, pero, para el resto de los mortales, fue en 2021 cuando quedó al descubierto la cruda dependencia que tiene la industria tecnológica con las fábricas que producen microchips. Sí, esas pequeñas cosas totalmente imprescindibles para el funcionamiento de los dispositivos electrónicos.
Ya puedes empezar a temblar, la escasez de semiconductores, de los chips de silicio, que actúan como la cabeza de los dispositivos informáticos, no nos viene bien. Porque, como deducirás, lo controlan todo en la actualidad, desde tu smartphone hasta el portátil, desde la tablet hasta tu nuevo coche, desde tu lavadora de última generación, hasta la Playstation 5 de tu chiquillo.
¿A qué viene esta crisis de semiconductores?
Como ocurrió con el resto de mercados, las restricciones impuestas por la pandemia obligaron a cerrar muchas de las fábricas que se dedicaban a la producción de estos chips, dificultando así su producción. Y esto no fue lo peor, es que, encima, aumentó la demanda de dispositivos informáticos, ya que todo el mundo estaba encerrado en su casa, necesitando trabajar por remoto o entretenerse con pantallas para no morir del asco haciendo pan o mirando a la pared. A todo esto se le sumó el inevitable retraso en los envíos y los transportes a escala mundial, también la subida del precio del silicio, elemento esencial de los microchips, y de otros componentes que se disputaban, con encono, las grandes potencias mundiales. Por si fuera poco, dos grandes productores de chips, como son Taiwán y China, sufrieron ciertas catástrofes que afectaron gravemente a la capacidad de sus fábricas.
Sabemos que la industria de los semiconductores fluctúa, que es veleidosa y atraviesa con regularidad ciertos ciclos de escasez, pero es que todo ha sucedido al mismo tiempo: dicha naturaleza fluctuante, la alteración de los patrones de demanda y oferta debidos a la pandemia, los desacuerdos entre las grandes potencias, y luego las catástrofes en los países de mayor producción… ¡Ni hecho a posta!
¿Quiénes han sido los peor parados a causa de la escasez?
Uno de los mercados que más se ha visto afectado es el automovilístico. De hecho, la asesoría financiera AlixPartners recuerda que, debido a la escasez de chips, la industria automovilística mundial ha perdido, este pasado 2021, 210.000 millones de dólares en ingresos. Eso son unos 7,7 millones de coches menos.
Pero no solo eso, la escasez de semiconductores también amenazó la disponibilidad de smartphones, tablets y demás cachibaches con microchips en los últimos meses del año pasado, que es, como sabéis, cuando se venden más estas cosas. El tirón de Navidad.
De hecho, la mismísima Apple, durante noviembre, tuvo que elegir entre sus iPads y sus iPhones, desviando los chips que tenía originalmente destinados a los primeros para los segundos, ya que los iPhones se venden más y les resultan más lucrativos. Esto significó que muchas tiendas especializadas en Reino Unido no tuvieran existencias del iPad mini o del iPad básico hasta pasados meses.
Pero ahora viene quizá el sector que más ha reivindicado el problema del silicio, los chips, los semiconductores y todos sus ancestros: el mundillo gamer. Porque el universo se puede hundir con un solo chasquido de Thanos pero que haya sido difícil de conseguir la nueva y flamante PlayStation 5 o la Xbox Series X es imperdonable. Y es que Sony se las vio canutas. Obligada, incluso, a frenar la producción de su producto estrella, la PS5, porque los cientos de chips que la componen resultan demasiado difíciles de conseguir. Lo mismo pasó con el gigante Nintendo, que advirtió, acongojado, que se encontraban en serios problemas. No podía satisfacer la demanda de su nueva consola. Mientras, las tarjetas gráficas de alta gama para juegos de pc todavía siguen siendo difíciles de encontrar. Si la cosa sigue así, en cualquier momento los niños rata, dejan los mando del Call of Duty, salen de su madriguera y van ellos mismos a refinar el silicio.
Si nos vamos al espectro estético, advertimos que si eres calvo pudiste no notarlo, el secador de pelo Supersonic y el moldeador de pelo Airwrap nos han faltado durante meses, ya que Dyson, el gigante tecnológico, sigue mendigando chips entre los pocos suministros que trasiegan a nivel mundial.
Conclusión: ¿Qué pasará en el futuro próximo?
Sí, la cosa está muy malita respecto al abastecimiento de chips y de materiales semiconductores. Aunque, tranquilos, los expertos avisan de que los efectos de la escasez solo tardarán un año en remitir. Habrá mejoras paulatinas, aunque seguramente no se satisfaga toda la demanda antes de 2023.
Muchas empresas, como Intel, han decidido crear nuevas fábricas de chips en Europa, América y Asia para evitar otro desabastecimiento a tal escala. Mientras tanto, medita, haz ejercicio, lee nuestros artículos, revisa tu sistema de seguridad, o intenta que el tira y afloja vuelva como deporte olímpico.
Hello and welcome back to our “Mystery Jet Ski”.
Much better than that Iker Jiménez’s program, which is lasting so long.
Today we will continue with our exhaustive research on the hacker’s world, and we will delve a little deeper into the concept of the “ethical hacker”. Is it true that there are good hackers, who are the so-called “White Hats”, and will Deportivo de La Coruña win the league again?
Do you already know who the so-called “White Hats” are?
In this blog we never tire of saying it: “Nobody is free from EVIL, because EVIL never rests”, and if in previous articles we saw that a bad hacker, roughly speaking, is a person who knows a lot about computers and uses his knowledge to detect security flaws in the computer systems of companies or organizations and take control, today we will see who is the archenemy of the bad hacker or cracker, the superhero of security, networks and programming… “The White Hat Hacker”.
White Hats are “evangelized” hackers who believe in good practice and ethical good, and who use their hacking superpowers to find security vulnerabilities and help fix or shield them, whether in networks, software, or hardware.
On the opposite side would be the “Black Hats”, the bad, knave hacker, who we all know for their evil deeds.
Both hack into systems, but the white hat hacker does it with the goal of favoring/assisting the organization he is working for.
White Hat Hacker = Ethical Hacker
If you thought that hacking and honesty were antonyms, you should know that, within the IT world, they are not.
Unlike black hat hackers, White Hats do their thing, but in an ethical and supervised manner with the goal of improving cybersecurity, not harming it.
And, my friend, there is demand for this.
A White Hat is not short of work, they are hypersolicited as security researchers and freelancers. They are the organizations’ sweet tooth for beefing up their cybersecurity.
Companies take the white hat hacker and put them to hack their systems over and over again. They find and expose vulnerabilities so that the company is prepared for future attacks. They highlight the ease with which a Black Hat could infiltrate, and get into the kitchen, a system, or they look for “back doors” within the encryption determined to safeguard the network.
We could almost consider White Hats as just another IT security engineer or insightful network security analyst within the enterprise.
Some well-known white hat hackers:
Greg Hoglund, “The Machine”. Known mostly for his achievements in malware detection, rootkits and online game hacking. He has worked for the U.S. government and its intelligence service.
Jeff Moss, “Obama’s Right Hand (on the mouse)”. He went on to serve on the U.S. National Security Advisory Council during Obama’s term. Today he serves as a commissioner on the Global Commission on the Stability of Cyberspace.
Dan Kaminsky, “The Competent One”. Known for his great feat of finding a major bug in the DNS protocol. This could have led to a complex cache spoofing attack.
Charlie Miller, “The Messi of hackers”. He became famous for exposing vulnerabilities in the products of famous companies such as Apple. He won the 2008 edition of Pwn2Own, the most important hacking contest in the world.
Richard M. Stallman, “The Hacktivist”. Founder of the GNU project, a free software initiative that is indispensable for an unrestricted understanding of computing. Leader of the free software movement since 1980.
Besides black and white, are there other hats?
We have already talked about the exploits of these White Hats, but what about the aforementioned “Black Hats”? Are there more “Hats”? Let’s see:
Black hats: the black hat hacker is the bad hacker, the computer criminal, the ones we know and automatically associate with the word hacker. The villains of this story. They start, perhaps, as inexperienced Script Kiddie and end up as crackers. Pure slang for how badass they are. Some go freelance, selling malicious tools, others work for criminal organizations as sophisticated as those in the movies.
Gray hats: Right in the middle of computer morality we find these hats, combining the qualities of black and white. They tend, for example, to look for vulnerabilities without the consent of the system owner, but when they find them they let you know.
Blue hats: These are characterized by focusing all their malicious efforts on a specific subject or collective. Spurred perhaps by revenge they master just enough to execute it. They can also be hired to test a particular software for bugs before its release. It is said that their nickname comes from the blue emblem of Microsoft’s curritos.
Red Hats: The Red Hats don’t like the Black Hats at all and act ruthlessly against them. Their vital goal? To destroy every evil plan that the bad hackers have in mind. A good Red Hat will always be on the lookout for Black Hat initiatives, their mission is to intercept and hack the hacker.
Green Hats: These are the “newbies” of the hacking world. They want their hat to mature into an authentic and genuine Black Hat. They will put effort, curiosity and sucking up in such an enterprise. They are often seen grazing in herds within hidden hacker communities asking their elders for everything.
Conclusions
Sorry for the Manichaeism, but we have the White Hat that is good, the Black Hat that is bad, and a few more colorful types of hats that walk between these two poles. I know you’re now imagining hackers sorted by color like pokémons or Power Rangers. If that’s all I’ve accomplished with this article it’s all worth it.
It is always a luxury to show off a new plugin in Pandora FMS, and for that reason we decided to devote an article in style to this Zendesk plugin on our blog. We will discuss what it is and how it can help us. Step by step, and concisely, so that no one gets lost along the way.
New Zendesk plugin added to Pandora FMS
But first: What is Zendesk?
Zendesk is a platform that channels the different communication modes between customer and company through a ticketing system.
A consolidated CRM company, devoted specifically to customer service, which designs software to improve relationships with users. Known for growing and innovating while building bonds and putting down roots in the communities where it lives. Its software, such as Pandora FMS, is very advanced and flexible, being able to adapt to the needs of any growing business.
Zendesk plugin
The plugin we are talking about today allows you to create, update and delete Zendesk tickets from the terminal, or from Pandora FMS console. For that, it makes use of the API of the service, which allows this system to be integrated into other platforms. Using a series of parameters, which would be the configurable options of the ticket, you may customize them as if you were working from Zendesk itself.
Zendesk Ticket System
Zendesk has an integrated ticketing system, with which you may track support tickets, prioritize them and resolve them.
To the point: System configuration to use the plugin.
To make use of the plugin, enable access to the API, either using password or token.
Do it from the API section in the administrator menu.
Plugin parameters
The plugin makes use of a number of parameters when creating, updating or deleting tickets. With them you may configure the ticket according to your own criteria and needs. Just as you would do it from Zendesk’s own system.
Method
-m
With this option you will choose whether to create, update or delete the ticket. Use post to create it, put to update it, and delete to delete it.
IP or hostname
-i
With this alternative you may add the ip or name of your site. Sites usually have this format:
Your username. Usually the email with which you signed up in Zendesk. Use this option, combined with password or token, depending on how you have it enabled.
Password
-p
The password to authenticate with the API.
Token
-t
The token to authenticate to the API. If you use this option, you do not have to use the password option.
Ticket name
-tn
The name to be given to the ticket.
Ticket content
-tb
Ticket text. It should be enclosed in quotation marks.
Ticket ID
-id
Ticket ID. This option is for when you want to update or delete a ticket.
Ticket status
-ts
The status of the ticket, which can be new, open, hold, pending, solved or closed.
Priority
-tp
The priority of the ticket, which can be urgent, high, normal or low.
Type
-tt
The ticket type, which can be problem, incident, question or task.
Ticket creation
By running the plugin with the appropriate parameters you may create tickets:
python3 pandora_zendesk.py -m post -i <ip or site name> -us <user> -t <token> -tn <ticket name> -tb <ticket content> -tp <priority> -tt <type> -ts <ticket status>
Example
With the following command:
python3 pandora_zendesk.py -m post -i pandoraplugin -us [email protected] -t <token> -tn "Problem with X" -tb "Something is giving some problem" -tp urgent -tt task -ts new
Interact with the API and the ticket will be created in your system.
Ticket update
You may update the tickets. The parameters are the same as in creation, but you have to add also the id, which will be the id of the ticket to be updated.
python3 pandora_zendesk.py -m put -i <ip or site name> -us <user> -t <token> -id <id ticket> -tn <ticket name> -tb <ticket content> -tp <priority> -tt <type> -ts <ticket status>
Example:
Let’s update the ticket we created in the example above, which has id #24
With the following command:
We see that the ticket has been updated and moved to pending tickets.
Ticket deletion
You may also delete a ticket by searching it by its ID with the following command:
You will be able to execute the plugin from the console, by means of an alert, which will make the use of the plugin easier.
To that end, go to the menu Commands in alerts:
Inside, create a new command that you will use to create alerts. To achieve this, run the plugin by entering its path and use a macro for each of the parameters used to create a ticket.
Add the description to each of these macros:
Once the command is saved, create an action to which assign this created command:
In each field below (the one of each macro where you have added a description when creating the command), add the value that you would have added to the parameter.
Once you have filled in all the fields of the necessary parameters, click Create.
Once done, go to List of alerts (don’t worry, once configured, you won’t have to repeat the process for each ticket you want to create), and create one.
Designate an agent and a module (it does not matter which one), and assign the action you just created. In the template, set the manual alert.
Once completed, click Add alert.
Now, to run the plugin, go to the view of the agent that you assigned to the alert and you will see it there. You may execute it by clicking the icon Force.
To establish different tickets, go to the action you created and change the values of the fields.
Just as we generated an alert for ticket creation, you may make another to update them and another to delete them to allow the use of the optimized plugin.
More integrations in ticketing services
Apart from Zendesk, there are more ticketing services that can be used from Pandora FMS by using a plugin. These are Redmine and Zammad, which have new plugins with which to create, update and delete tickets in these systems. And Jira and OTRS, which also have a plugin in the library that allows you to use these services easily from Pandora FMS.
Today I will tell you a little story, that of good Redhat6 and Pandora FMS, a relationship that endured, on favorable terms, everything it had to endure, but finally fell apart. Calm down, they still will stay as friends.
Pandora FMS stops supporting RedHat6 this 2022
Redhat6 was once the generation of Red Hat’s complete set of operating systems, designed for mission-critical enterprise computing and certified by leading enterprise software and hardware providers. Many systems were based on Rhel6. Among them we highlight CentOS, which in its day, was a derivation, a kind of free clone of Redhat, with the same life cycle.
As many of us know, CentOS 6 reached the end of its official life cycle, on November 30th, 2020, so it is a system that has been obsolete for more than a year. However, we, Pandora FMS, have maintained a year of extended support (2021) for these systems to make transition and migration from CentOS 6-based systems to systems based on CentOS 7 or the latest RedHat 8 easier. But this is over by 2022.
The Future of RedHat
What will happen now? Well, let’s talk about RedHat Enterprise Linux 8. Because the most cutting-edge IT is hybrid IT. And in order to transform a system into a hybrid environment, from data centers to Cloud services, certain formalities are needed. Like an adaptable scalability. Seamless workload transfer. Application development… And, of course, RedHat already has an operating system that meets all these requirements, the path to its future is RedHat 8. Cutting-edge technology that adapts to businesses and has the essential features, “from container tools to compatibility with graphic processing units”, to launch tomorrow’s technology today.
Some alternatives to CentOS
Are there any alternatives for team administrators who already moved on? Well, we have some candidates and we know them well because we support them.
RHEL for Open Source Infrastructure: RedHat itself launched this alternative to the community so that no one would sigh for the death of CentOS, even so we are facing a clone of RHEL.
Rocky Linux: It was developed by Greg Kurtzer and named after Rocky McGough. During its first 12 hours of life online, it was downloaded 10,000 times.
AlmaLinux: Although now managed by its own foundation,AlmaLinux was launched in its day by those responsible for CloudLinux. Since its inception it was claimed by many as the best positioned successor to CentOS, now its version 8.5 is the proposed exact copy of RHEL 8.5.
If you have to monitor more than 100 devices, you may also enjoy a Pandora FMS Enterprise FREE 30-day TRIAL. Cloud or On-Premise installation, you choose!! Get it here.
Finally, remember that if you have a reduced number of devices to monitor, you may use Pandora FMS OpenSource version. Find more information here. Don’t hesitate to send us your questions. Pandora FMS team will be happy to help you!
La mayoría de nosotros ha visitado un hotel alguna vez en su vida. Llegamos a recepción, si solicitamos habitación nos entregan una llave, si vamos a visitar un huésped nos conducen a la sala de espera como visitante, si vamos a usar su restaurante nos etiquetan como comensal o si asistimos a una conferencia sobre tecnología vamos a su salón principal. No se da el caso de que terminemos en la piscina o entremos a la lavandería por una razón muy importante: nos asignaron un rol al llegar.
¿Sabes qué es el Control de Acceso Basado en Roles o RBAC?
En el campo de la informática también, desde sus inicios, todo esto se ha tenido en cuenta, pero recordemos que las primeras máquinas eran sumamente costosas y limitadas, así que tuvimos que conformarnos con recursos más simples y sencillos antes de que llegara el Control de Acceso Basado en Roles (en inglés RBAC).
Lista de control de acceso
En el año 1965 existió un sistema operativo de tiempo compartido llamado Multics (creación de los Laboratorios Bell y el Instituto Tecnológico de Massachusetts) el cual fue el primero en utilizar access-control list (ACL). Yo ni siquiera había nacido en esa época así que doy un voto de confianza a Wikipedia por esta información. Lo que sí conozco, de primera mano, es la lista de control de acceso a sistema de ficheros (en inglés filesystem ACL) que usaba Netware Novell® a principios de 1990 y de la que ya os hablé en un anterior artículo en este mismo blog.
Pero volvamos a la lista de control de acceso: ¿Qué es un control de acceso (access control)? Esto es lo más sencillo de explicar, es, nada más y nada menos, que una simple restricción a un usuario respecto a un recurso. Ya sea por medio de una contraseña, una llave física o incluso sus valores biométricos, como la huella digital, por ejemplo.
Una lista de control de acceso entonces es anotar a cada uno de los usuarios que pueden acceder (explícitamente permitido) o no (explícitamente prohibido, bajo ningún aspecto). Como ya imagináis, esto, se vuelve tedioso, estar pendiente de anotar uno por uno a los usuarios y también de los procesos propios de sistema operativo o de los programas que se ejecuten sobre él… Ya veis, vaya lío anotar todas las entradas, conocidas en inglés como access-control entries (ACEs).
Siguiendo el ejemplo de derechos sobre ficheros, directorios y más allá (tales como recursos completos: discos ópticos o «disco duros» enteros) fue que llegué a trabajar, el siglo pasado, con Netware Novell®. Esto es un Filesystem ACL (Network File System access-control list). Luego vino, superado el susto del milenio, el NFS ACL versión 4 que recogió y amplió, de manera normalizada, todo lo que habíamos usado desde 1989 cuando el RFC 1094 estableció el Network File System Protocol Specification. Considero que he resumido muchísimo y debería nombrar, al menos, el uso que le da MS Windows® a las ACL por medio de su Active Directory (AD), las Networking ACL para los casos de hardware de red (enrutadores, concentradores, etc.) y las implementaciones que hacen algunas bases de datos.
Todas estas tecnologías, y más, echan mano del concepto de listas de control de acceso, y como todo en la vida evoluciona pues surgió el concepto de grupos que compartían algunas similitudes, y se podía así ahorrar trabajo manteniendo al día las listas de acceso. Ahora imaginad que tenemos una, o más listas de control de acceso, que sólo admiten grupos. Pues bien, en 1997 un señor llamado John Barkley demostró que este tipo de listas equivale a un mínimo Control de Acceso Basado en Roles, pero RBAC al fin y al cabo, lo cual nos lleva al meollo del asunto…
Role-based access control RBAC
El concepto de rol en la RBAC va más allá de los permisos, también pueden ser unas habilidades bien delimitadas. Además, se pueden tener varios roles asignados, según sea la necesidad del protagonista (usuario, software, hardware…). Volviendo al ejemplo del departamento de cobro. Un vendedor, que ya tiene un rol correspondiente como tal, también podría tener un rol en cobro para analizar el pago de los clientes y enfocar sus ventas en los solventes. Con los roles esto es relativamente sencillo de hacer.
Beneficios de RBAC
• Primero que nada, RBAC disminuye muchísimo los riesgos de brecha de seguridad y fugas de datos. Si los roles fueron creados y asignados con rigor, está garantizado el retorno de la inversión del trabajo realizado en RBAC.
• Reduce costos al asignar más de un rol a un usuario. Es innecesario comprar ordenadores virtuales nuevos si pueden compartir con grupos ya creados. Dejad que Pandora FMS monitorice y os proporcione información para tomar decisiones acerca de redistribuir la carga horaria o, llegado el caso y solo de ser necesario, adquirid más recursos.
• Regulaciones federales, estatales, o locales sobre privacidad o confidencialidad pueden ser exigidas a las empresas, y las RBAC pueden ser una gran ayuda para cumplir y hacer cumplir dichas exigencias.
• Las RBAC no solamente ayudan a la eficiencia en las empresas cuando se contratan nuevos empleados, también ayudan cuando terceros realizan trabajos de seguridad, auditorías, etc. porque de antemano, y sin conocer realmente quién o quiénes vendrán, ya tendrán su espacio de trabajo bien delimitado en uno o varios roles combinados.
Desventajas de RBAC
• El número de roles puede crecer de manera vertiginosa. Si una empresa tiene 5 departamentos y 20 funciones podemos tener hasta un máximo de 100 roles.
• Complejidad. Tal vez sea esto lo más difícil: identificar y asignar todos los mecanismos establecidos en la empresa y traducirlos en RBAC. Esto requiere de mucha labor.
• Cuando un sujeto necesita ampliar sus permisos de manera temporal, las RABC pueden convertirse en una cadena difícil de romper. Para esto Pandora FMS propone una alternativa que explico en la siguiente sección.
Reglas de RBAC
Para aprovechar al máximo las ventajas del modelo RBAC, el desarrollo del concepto de roles y autorizaciones es siempre lo primero. Es importante que el manejo de identidades para poder asignar estos roles sea hecho también de una manera estandarizada, para ello la norma ISO/IEC 24760-1 del año 2011 intenta lidiar con ello.
Hay tres reglas de oro para las RBAC que deben ser vistas ordenadas en el tiempo y aplicadas en su debido momento:
1. Asignación de roles: Una persona puede ejercer un permiso sólo si se le ha asignado un rol.
2. Autorización de roles: El rol activo de una persona debe estar autorizado para esa persona. Junto con la regla número uno, esta regla garantiza que los usuarios solo pueden asumir los roles para los que están autorizados.
3. Autorización de permisos: Una persona puede ejercer un permiso sólo si el permiso está autorizado para el rol activo del sujeto. Junto con las reglas uno y dos, esta regla garantiza que los usuarios sólo pueden ejercer los permisos para los que están autorizados.
La versión Enterprise de Pandora FMS dispone de un RBAC ultra completo y de mecanismos de autenticación como LDAP o AD, además de mecanismos de doble autenticación con Google® Auth. Además, con el sistema de etiquetas o tags que maneja Pandora FMS podemos combinar RBAC con ABAC. El attribute-based access control es similar al RBAC pero en vez de roles está basado en atributos del usuario. En este caso, etiquetas asignadas, aunque pudieran ser otros valores como ubicación o años de experiencia dentro de la empresa, por ejemplo.
Pero eso, eso queda para otro artículo…
Antes de despedirnos, recuerda que Pandora FMS es un software de monitorización flexible, capaz de monitorizar dispositivos, infraestructuras, aplicaciones, servicios y procesos de negocio.
¿Quieres conocer mejor qué es lo que Pandora FMS puede ofrecerte? Descúbrelo entrando aquí: https://pandorafms.com/es
Si cuentas con más de 100 dispositivos para monitorizar puedes contactar con nosotros a través del siguiente formulario: https://pandorafms.com/es/contactar/
Además, recuerda que si tus necesidades de monitorización son más limitadas tienes a tu disposición la versión OpenSource de Pandora FMS. Encuentra más información aquí: https://pandorafms.org/es/
No dudes en enviar tus consultas. ¡El equipazo de Pandora FMS estará encantado de atenderte!
We apologize in advance for this extremely freaky reference: If in the well-known science fiction saga Foundation there was a duty to collect all the information of the galaxy to save it, at Pandora FMS we have assigned ourselves the task of making a glossary worthy enough with all the “What are” and the “What is” of technology. And today, without further delay or freakiness, it’s time to define the acronyms: BYOD, BYOA, BYOT.
* Warning to (very) lost sailors: This “Byo-” has NOTHING to do with that other prefix element, “Bio”. Thank you. Get back to your beloved diet
That means indeed: “Bring your own tech from home, kid”. This is what BYOT means. A policy that allows employees to bring their own electronic devices, personal ones, from home to work.
This has advantages even if you don’t imagine it. And the top companies each give their distinctive approach to implementing such a policy. Some offer employees remuneration to purchase such technology. Other companies think better of it and expect their employees to put up with half or all of the expenses. Some even spend the money but then they demand for employees to pay for some services separately, such as phone service or data…
In any case, no matter how you buy your new devices or whoever pays for the Internet that month, if the device is connected to a corporate network, a highly professional IT department must secure and manage the device.
BYOD (Bring your own device)
Correct. You have translated well: “Use your own device from home, kid”. This term refers again, although on a different scale, to the tendency of employees to use personal devices to work and connect to their company’s networks, access their systems or relevant data. You know what we mean when we talk about “personal devices”… your smartphone, your laptop, your tablet or, I don’t know, your 4-gigabyte USB.
The truth is that this rings a bell, companies, and especially since this terrible pandemic, now support teleworking. BYOD is here, more and more, working from home, maintaining a flexible schedule, including trips and urgent departures, in the middle of the morning, to get a Coke or to pick up your kid from school.
As it could not be otherwise, for the directives of your company the security of your BYOD is a crucial issue. Because for you it can be a whole morale boost, even on productivity, the fact of working with your trustworthy device, but if the IT department does not take care of checking it before, the access of your personal devices to the company network can raise serious security concerns.
The best thing in this case is to establish a policy where it is decided whether the IT department is going to protect personal devices and, if so, how it is going to determine the access levels. Approving types of devices, defining security policies and data ownership, calculating the levels of IT support granted to BYOD… Then informing and educating employees on how to use their devices without ultimately compromising company data or networks. Those would be the steps to follow.
Studies show that there is higher productivity for employees using BYOD. Nothing less than a 16% increase in productivity in a normal workweek, for those who work forty hours. It also increases job satisfaction and the fact that new hires decide to stay through a flexible work arrangement. Employee efficiency is higher due to the comfort and confidence they have in their own devices. Technologies are integrated without the need to spend on new hardware, software licenses or device maintenance…
Everything looks wonderful, although there are also certain disadvantages as usual. Data breaches are more likely due to theft or loss of personal devices, as well as employee dismissal or departure. Mismanagement of firewalls or antivirus on devices by employees. Increased IT costs, and possible Internet failures.
BYOA (Bring your own application)
And what’s that? BYOA is basically the tendency of employees to use third-party applications and Cloud services at work.
As we know, mobile devices, owned by employees, have personal-use applications installed. However, they access these applications and different services through the corporate network. Well, this is the aforementioned BYOA.
There are benefits, of course. All those who may be listening to Spotify or using your own Google Drive without paying directly for the Internet. However, the higher the BYOA, like the higher BYOD and BYOT, the bigger the security holes in your organization. No one suffers more than a company’s IT department when it comes to thinking about how vulnerable corporate data can be. Especially when they are stored in the Cloud.
Conclusions
BYOT, BYOD, BYOA solutions are very efficient in the way an employee works. High morals, high practicity, and high productivity. However, well, they do pose certain cracks in the corporate network. Sensitive data and unsupported/unsecured personal devices, sometimes are not the best combination.
“BYO” products have advantages but they need a seasoned, conscious, proactive IT department, always protected by management policies of BYOT, BYOD, BYOA.
If you have to monitor more than 100 devices, you may also enjoy a FREE 30-day Pandora FMS Enterprise TRIAL. Installation in Cloud or On-Premise, you choose !! Get it here.
Last but not least, remember that if you have a reduced number of devices to monitor, you can use the Pandora FMS OpenSource version. Find more information here.
Do not hesitate to send us your questions. Pandora FMS team will be happy to help you!
In response to the vulnerability tagged as CVE-2021-44228, known as “Log4Shell”, from Artica PFMS we confirm that Pandora FMS does not use this Apache log component and therefore it is not affected.
Discovered by the Alibaba security team, the problem refers to a case of remote execution of unauthenticated code (RCE) in any application that uses this open source utility and affects unpatched versions, from Apache Log4j 2.0-beta9 up to 2.14. 1.
It is true that if we used it, we would be compromised, but fortunately it is a dependency that is not necessary for the operation of our product.
In turn, we must also state that the Elasticsearch component for the log collection feature is potentially affected by CVE-2021-44228.
Recommended solution
There is, however, a solution recommended by the Elasticsearch developers:
1) You can upgrade to a JDK later than 8 to achieve at least partial mitigation.
2) Follow the Elasticsearch instructions from the developer and upgrade to Elasticsearch 6.8.21. or 7,16,1 superior.
Additional solution
In case you can’t update your version here we show you an additional method to solve the same problem:
Disable formatMessageLookup as follows:
Stop the Elasticsearch service.
Add -Dlog4j2.formatMsgNoLookups = true to the log4j part of /etc/elasticsearch/jvm.options
Restart the Elasticsearch service.
In the event of any other eventuality we will keep you informed.
Let’s get to the point about data management: Businesses need data, but accumulating too much can be detrimental. Data overcrowding can corrupt IT professionals, turning them into greedy hoarders. Being indigestible with excessive repeated, outdated or banal information, the so-called ROT data, is bad. Companies of the world! The Devil tempts you with Big Data! Something that, if too much, could be harmful! We tell you all about it in this article.
The five mistakes we make in data management
The Liturgical Department of Pandora FMS, because yes, we have a Liturgical Department, right next to the Communication Department, has counted these past weeks the most despicable and sinful faults within data management. We counted up to five sins. Relax, they are not normally committed by a single offender, they are usually mini-points accumulated, over time, by several members of a team. However, we are going to list these vices so that you can count the ones you carry on your own. The scale is this:
One fault committed: Sinner.
Two faults committed: Great sinner.
Three faults committed: Excessive sinner.
Four: On the doorway to hell.
Five: You will burn in hell as the Great Grimoire points its tridents at you.
First offense:
You and your company have an ungovernable desire for data. You end up collecting an immensity of them in the hope of achieving the greatest possible advance. However, unfortunately, finding something worthwhile among such a wealth of information is like finding the broom in a student flat: a very difficult task.
Second offense:
Do you know when you have had the lunch of your life in the trendiest burger joint and despite being full, you order the dessert menu to see what cheese cake they have? Well, data excess, and the consumption of all the data you may swallow without a planned purpose, is comparable. That’s right, without a narrow archiving process, a company’s eager urge to fagotize data ends up in a bundle of unnecessary, outdated, and useless data.
Third offense:
Greed overcomes you! And you start hoarding and hoarding, carried away by greed. In the end, this leads to spending money on more hardware, the most cutting-edge on the market, to process and store all that mass of data you accumulate. You do that instead of finding a reliable process to classify, archive, and remove junk data.
Fourth offense:
Due to the massive amount of data that you have, you are lazily and slowly carrying out your queries and your processes. Indeed, the more data you accumulate, you and your company, the more time it will take to process it and make, for example, backups.
Fifth offense:
A company can feel more secure and stable the more data it has, however, the truth is different, the more data it has, the higher the concern. Having the barrel of data completely full does not mean anything if in fact those data are not used correctly.
Recovery Point Objective (RPO) and Recovery Time Objective (RTO)
How many faults/sins have you accumulated from this list? Have you raised your hand many times yelling “Yes, I am guilty”? Well, before you burn in hell, I want to tell you that there is a plan to escape its cauldrons: find and set a recovery point objective (RPO) and a recovery time objective (RTO). Yes, sir, that’s the first step! The RPO defines a tolerable amount of data loss before a company cannot recover. And the RTO, on the other hand, marks the time that data professionals need to recover the data without getting the business in an irreparable state. To give you an idea, one of the ways to expand the RPO is to backup data logs. However, large amounts of data can make backup times too long, putting our company in a bind again. That is why there is no need to accumulate so much useless data.
Do not mistake a recovery plan with a backup plan. You should first create a recovery plan and then prepare your backup plan. The backup plan will nuance your RTO and RPO goals, while the recovery plan will address disaster recovery and high availability objectives.
Conclusions
Today in this blog we learned that data excess can be an indication of a failed business plan and we have exposed the five mistakes that usually cause the increase of this unnecessary data. From everything we have concluded that the best thing is to have a purpose to reach with that data and to have a manageable amount of it, thus allowing professionals to operate in a simpler way.
Money is not the answer, paying for new hardware always seems like the solution but sometimes it is just a sign that your company is not competent enough. Knowing about these problems and finding a solution can save time and money.
Would you like to find out more about what Pandora FMS can offer you? Learn more by clicking here. If you have to monitor more than 100 devices, you may also enjoy a Pandora FMS Enterprise FREE 30-day TRIAL. Cloud or On-Premise installation, you choose!! Get it here.
Finally, remember that if you have a reduced number of devices to monitor, you can use the Pandora FMS OpenSource version. Learn more information here.
Do not hesitate to send us your questions. The great team behind Pandora FMS will be happy to assist you!And if you want to keep up with all our news and you like IT, releases and, of course, monitoring, we wait for you in our blog and in our different social networks, from Linkedin to Twitter going through the unforgettable Facebook. We even have a Youtube channel with the best narrators. Oh, we almost forgot, we also have a new Instagram channel! Follow our account, we still have a long way to go to match that of Billie Eilish.
The current global pandemic of Covid-19 has brought us a few gifts: global desolation, earaches from the rigid rubber bands of the FFP2 masks, applause for Health at eight in the afternoon on the balconies, fear of infected ones and staff shortage in the data center industry and shortage of IT professionals. In this article we will delve into this last topic.
*We will already devote a double-page report to the saw rubbers of the FFP2
Lack of staff in the data center industry
It is like that how our beloved pandemic has turned the world upside down, at so many levels that even the data center sector has noticed it. Data centers have received an unexpected amount of work due to the reinterpretation of the labor system and telecommuting. In fact, the size of the global data center industry has grown dramatically. This is a direct consequence of higher exposure and need for the Internet, which has come hand in hand with the confinement imposed by governments around the world to fight against infections. That way, it is estimated that the size of the world data center market will reach in the near future (2021-2026), nothing more and nothing less, than 251,000 million dollars.
Source: Uptime Institute Intelligence
And what is the growth of the global data center market leading to? Well, to a proportionally direct and parallel need of professionals in the sector. Estimates from the Uptime Institute, the long-standing champion of digital infrastructure performance, suggest that the number of staff required to manage data centers across the globe will rise from about two million today to nearly 2.3 million in three years.
This turns into countless new technical jobs for the data center industry. Of all types and sizes. With different requirements. From design to operation. And around the world.
You still don’t want to go send resumes?
Why the shortage of IT professionals and other personnel in the data center sector?
Well, just as remote regions are fighting for the repopulation of their villages, this sector is already dealing with the lack of personnel. It is not an easy subject. According to the Uptime Institute, it is very difficult to find suitable candidates for vacant positions at the moment, so if you want to look for a job in your domain, you must be prepared. Although, as it is often the case, in most positions, work experience, internships or work-study training may make up for a certain lack of skill and experience.
With much of the tech industry currently struggling to find qualified staff, data centers are finding it a bit more difficult to locate and hire professionals in high-demand roles. Like power systems technicians and analysts, facilities control specialists, or robotics technologists, or as I call them “Robotechnologists.”
If you’re serious about it and want to be one of the data centers, success in your quest requires a combination of special skills. Yes, exactly, like when you want to be a ninja or a neo noir detective. First, extensive infrastructure knowledge is required. If you have boards with mechanical or electrical equipment, the better. Programming, platform management, specific technological tools… Basic technological knowledge is also very important. In addition, as in the ninja world or in neo-noir crimes, data centers need specialists with practical determination and ample capacity to solve problems, critical thinking, a drive for business objectives, and, not least to know how to behave, both in teamwork and customer service. For all this string of skills and qualities it is making it difficult for them, in the data center industry, to find personnel. But, well, what can we do? There have also been few Fujibayashi Nagato (ninja) and Sam Spade (detective).
As a result, many data centers today are understaffed. They are overloaded, with more job vacancies than people ready to apply for them. And this without taking into account the high demand, outside the data center sector, for professionals with knowledge of computer science and software. The reality is like this, everyone needs a tech expert among their ranks, and sometimes you have to fight for them.
Source: Uptime Institute Intelligence
Debido al cataclismo mundial del Covid-19 y la recesión que ha traído, el estilo de trabajo ha cambiado, trayéndonos de súbito el teletrabajo y las operaciones remotas. Esto ha supuesto que los servicios de los centros de datos incrementen su rendimiento para que las empresas de todo el planeta pudieran operar. Los centros de datos están en un punto crítico. Tienen más trabajo pero menos personal especializado para realizarlo. Además, en estos tiempos, resulta bastante difícil encontrar a una plantilla a la altura. Quizá con la adopción de La Nube y nuevos avances en la tecnología digital se pueda cimentar un sistema, post-Covid-19, que lleve a las empresas hacia un futuro próspero.
Some conclusions
Due to the global cataclysm of Covid-19 and the recession it has brought, work style has changed, suddenly bringing us telecommuting and remote operations. This has meant that data center services increase their performance so that companies around the world could operate. Data centers are at a critical point. They have more work but less specialized personnel to do it. In addition, these days, it is quite difficult to find a team to match. Perhaps with the adoption of the Cloud and new advances in digital technology, a system, post-Covid-19, can be established that will lead companies towards a prosperous future.
If you have to monitor more than 100 devices, you may also enjoy a FREE 30-day Pandora FMS Enterprise TRIAL. Installation in Cloud or On-Premise, you choose !! Get it here.
Last but not least, remember that if you have a reduced number of devices to monitor, you can use the Pandora FMS OpenSource version. Find more information here.
Do not hesitate to send us your questions. Pandora FMS team will be happy to help you!
Software developers and manufacturers around the world are under attack by cybercriminals. It is not like we are in a time of the year in which they spread more and they barricade themselves in front of the offices, with their evil laptops seeking to blow everything up, no. They are actually always there, trying to violate information security, and in this article we are going to give you a little advice on the subject.
No one is safe from all threats
Whether it is a middling attack or sophisticated and destructive (as it happened to our competitorsSolarwinds andKaseya) evil never rests. The whole industry faces an increasingly infuriating threat landscape. Almost every day we wake up with some news of an unforeseen cyber attack that brings with it the consequent wave of urgent and necessary updates so that our system is safe… Nobody is spared, real giants have fallen over. The complexity of the current software ecosystem means that a vulnerability in a small library affects hundreds of applications. It happened in the past (openssh,openssl, zlib, glibc…) and it will continue to happen.
As we pointed out, these attacks can be very sophisticated or they can be the result of a combination of third-party weaknesses that make the client vulnerable, not because of the software, but because of some of the components in its environment. That’s why IT professionals should demand that their software vendors take security seriously, both from an engineering standpoint and from vulnerability management.
We repeat: No one is safe from all threats. The software vendor that took others out of business yesterday may very likely be tomorrow’s new victim. Yes, the other day it was Kaseya, tomorrow it could be us. No matter what we do, there is no 100% security, no one can guarantee it. The question is not to prevent something bad from happening, the question is how to manage that situation and get out of it.
Pandora FMS and ISM ISO 27001
Any software vendor can be attacked and each vendor must take the necessary additional measures to protect itself and its users. Pandora FMS encourages our current and future clients to ask their suppliers for more consideration in this matter. We include ourselves.
Pandora FMS has always taken security very seriously, so much so that for years we have had a public policy of “Vulnerability disclosure policy” and Artica PFMS as a company, is certified with the ISO 27001. We periodically employ code audit tools and maintain some modified versions of common libraries locally.
In 2021, in face of the security demand, we decided to go one step further, and make ourselvesCNAofCVE, to give a much more direct response to software vulnerabilities reported by independent auditors.
Decalogue of PFMS for better information security
When a client asks us whether Pandora FMS is safe, sometimes we remind them of all this information, but it is not enough. Therefore, today we want to go further and prepare a decalogue of revealing questions on the subject. Because some software developers take security a little more seriously than others. Relax, these questions and their corresponding answers are valid for both Microsoft and Frank’s Software or whatever thing you may have. Since security does not distinguish between big, small, shy or marketing experts.
Is there a specific space for security within your software life cycle?
At Pandora FMS, we have an AGILE philosophy with sprints (releases) every four weeks, and we have a specific category for security tickets. These have a different priority, a different validation cycle (QA) and of course, a totally different management, since they involve external actors in some cases (through CVE).
Is your CICD and code versioning system located in a safe environment and do you have specific security measures to ensure it?
We use Gitlab internally, on a server in our physical offices in Madrid. People with name and surname, and unique username and password have access to it. No matter what country they are in, their access through VPN is individually controlled and this server cannot be accessed any other way. Our office is protected by a biometric access system and the server room with a key that only two people have.
Does the developer have an ISMS? (Security Incident Management System)
Artica PFMS, the company behind Pandora FMS, is certified with ISO 27001 almost from its beginnings. Our first certification was in 2009. ISO 27001 certifies that there is an ISMS as such in the organization.
Does the developer have a contingency plan?
We not only have one, we have had to use it several times. With COVID, we went from 40 people working in an office in Gran Via (Madrid) to each and everyone of them working at home. We had power outages (for weeks), server fires and many other incidents that put us to the test.
Does the developer company have a security incident communication plan that includes its customers?
It has not happened many times, but we have had to release an urgent security patch, and we have notified our clients in a timely manner.
Is there an atomic and nominal traceability on code changes?
The good thing about code repositories, like GIT, is that these kinds of issues have been solved for a long time. It is impossible to develop software professionally today if tools like GIT are not fully integrated into the organization, and not only into the development team, but also into the QA, support, engineering… teams.
Do you have a reliable update distribution system with digital certifications?
Our update system (Update Manager) distributes packages with digital certificates. It is a private system, duly secured and with its own technology.
Do you have an open public vulnerability disclosure policy?
Do you have an Open Source policy that allows the customer to see and audit the application code if necessary?
Our code is open, anyone can review it athttps://github.com/pandorafms/pandorafms. In addition, some of our customers ask us to audit the source code of the Enterprise version and we are delighted to be able to do so.
Do the components/third-party purchases meet the same standards as the rest of the parts of the application?
Yes they do, and when they do not comply, we maintain them ourselves.
BONUS TRACK:
Does the company have any ISO Quality certification?
ISO 27001
Does the company have any specific safety certification?
National Security Scheme, basic level.
Conclusion
Pandora FMS is ready for EVERYTHING! Just kidding, as we have said, everyone in this sector is vulnerable, and of course the questions in this decalogue are elaborated with certain cunning, after all, we had solid and truthful answers prepared in advance for them, however, the real question is: Do all software vendors have answers to those questions?
Would you like to find out more about what Pandora FMS can offer you? Find out clicking here . If you have to monitor more than 100 devices, you can also enjoy a FREE 30-day Pandora FMS Enterprise TRIAL. Installation in Cloud or On-Premise, you choose !! Get it here.
Last but not least, remember that if you have a reduced number of devices to monitor, you may use Pandora FMS OpenSource version. Find more information here .
Do not hesitate to send your questions. The great team behind Pandora FMS will be happy to assist you! And if you want to keep up with all our news and you like IT, release and, of course, monitoring, we are waiting for you in our blog and in our different social networks, from Linkedin to Twitter through the unforgettable Facebook . We even have a YouTube channel , and with the best storytellers. Ah well, we also have a new Instagram channel ! Follow our account, we still have a long way to go to match that of Billie Eilish.
Having an open, safe and efficient digital administration is the new objective of every Government these years. Although the recent pandemic may have hampered any master plan for system evolution and optimization, there is still some hope. The hybrid Cloud reaches the public sector, among other advances. We’ll tell you all about it in our blog!
The pandemic strengthens the hybrid cloud in the public sector
“The Cloud”, that abstract fantasy, has made possible large-scale government teleworking (so much so that “IDC ensures that 74% of government organizations worldwide will switch to remote work in the future”), in addition to giving institutions the opportunity to test new applications and experiment with them. Being the advantages of scalability and the safety benefits the first objectives.
The public sector, like so many others, got down to work when the shackles of Covid-19 fell on them. Like concert halls or gyms, they had to get reinvented, and soon after new online platforms arrived and heavy investments were made in Artificial Intelligence, Cloud-based management systems and other transformative solutions that give a break to organisms collapsed by difficult conditions. In fact, IDC Research Spain has confirmed that “40% of the public sector already works in a hybrid cloud environment compared to 90% of private companies”. This shows, indeed, that Public Administrations are heading towards new models.
The Hybrid Cloud in the public sector
So, we can say that damn Covid-19 accelerated not only masks sales, but also the adaptation of the most cutting-edge technologies to governments. They were suddenly aware, for example, as we say, of the possibilities of the Hybrid Cloud. Due, of course, to the rising popularity of hybrid IT environments; that although we know that they can be difficult to manage at high scale, and that they require specific capacities, they will always be welcome from now on.
What caused the skepticism regarding Hybrid Cloud in the public sector? Well, surely it was because the governmental institutions throughout the planet faced several and notorious obstacles related to the subject. Ensuring a high-performance infrastructure is no easy task, for example. Certain types of traditional monitoring technologies do not work in such heterogeneous ecosystems. In addition, sometimes, the speed at which some tools are deployed in the Cloud can lead to security problems.
Optimize Hybrid Cloud Management in the public sector
But is it all over? Do governments have nothing to say in the face of these “different and notorious obstacles”? Relax, as the highest paid coaches and cartoon heroes show us, there is always hope, even to optimizehybrid Cloud management in the public sector.
A new approach
From Pandora FMS, a company devoted to delivering the best monitoring software in the world, we tell you: NOT ALL MONITORING TECHNOLOGIES WORK THE SAME.. Many are either designed for local data centers or for the Cloud, but not both. This is where lots of improvements can be made and IT experts must intervene, especially to prioritize a plan for monitoring hybrid environments. Always with a vision of the general state of the systems, the performance and the security of the network, the databases, the applications, etc. It seems that no one had the time or the necessary skills for this task, which ends up exposing organizations, especially regarding security.
The hybrid network
After being aware that investing time and efforts in Cloud services is necessary, the idea that connectivity and network performance are a key factor will come hand in hand, at least to guarantee the provision of quality services.
So we must address issues such as network latency, increased cloud traffic, interruption prevention, and any other problem, before they affect us and the end user.
It goes without saying that Software-defined wide-area network (SD-WAN) technologies play an obvious role in hybrid technologies and can help simplify network management tasks and avoid network overload.
Beware of identity and access control
No, it is not crazy to monitor who has access to what. We do it here and call it “Standard Security Practice”. However, when everything becomes a hodgepodge of employees/users/everyone having access, and you interact with data from a large number of sources, things get a bit complicated.
Indeed, rushing is not good at all, and the implementation of the Cloud is wished right away, “immediately”, so access controls sometimes bear the brunt and remain a vulnerable point. So, you only have to take your chances on multi-factor authentication, as an improved official replacement for passwords for digital access.
Zero-trust frameworks, network segmentation, and new security practices for the provider are other healthy practices to better be safe than sorry and help protect the assets hosted in our hybrid environment.
New skills, new mindset
Big changes need small changes. The capabilities and skills that are necessary for managing the hybrid Cloud are far from those that are needed for a local infrastructure. The data center is already an abstraction of what it was and what IT teams know well. Technology is the future, but also the most current present, and if government institutions do not develop the adequate and necessary capacities to support such technology, there will be neither a well-managed hybrid cloud, nor anything to do in areas such as monitoring and security.
Conclusions
As we started saying, the global pandemic of Covid-19 has justified and potentiated the modernization of technology, and accelerated adaptation to the Cloud and IT environments, but there is still a long way to go for these services to be really used by institutions and their citizens. And this should be a priority, as well as its good performance, accessibility and security. At the appropriate time, supported by the necessary investment and work, I am sure the Cloud will reveal itself in all its splendor showing us its full potential.
Would you like to find out more about what Pandora FMS can offer you? Find out clicking here . If you have to monitor more than 100 devices, you can also enjoy a FREE 30-day Pandora FMS Enterprise TRIAL. Installation in Cloud or On-Premise, you choose !! Get it here.
Last but not least, remember that if you have a reduced number of devices to monitor, you may use Pandora FMS OpenSource version. Find more information here .
Do not hesitate to send your questions. The great team behind Pandora FMS will be happy to assist you! And if you want to keep up with all our news and you like IT, release and, of course, monitoring, we are waiting for you in our blog and in our different social networks, from Linkedin to Twitter through the unforgettable Facebook . We even have a YouTube channel , and with the best storytellers. Ah well, we also have a new Instagram channel ! Follow our account, we still have a long way to go to match that of Billie Eilish.
Who does not know about Cyber days by now? A date that first debuted in November 2005, for the good of all geeks around the world, and that remains to this day as one of the most anticipated events of the year, at least for those of us with minimal technological ambition.
Cyber days in Pandora FMS: 25% less in our training
In a company where we are devoted to monitoring systems and networks with the best software created for this, Pandora FMS, we were not going to be less, therefore, we now show our cards on the table and show you our hot sale for these cyberdays.
Cyber days in Pandora FMS: 25% off in our training
That is, Pandora FMS offers a25% discount on its training courses until December 31, with its corresponding official certification.
The objective of PAT training courses is to help you learn how to install Pandora FMS, teach you to monitor remotely and locally (with agents) and manage Pandora FMS features such as events, alerts, reports, graphical user views, network recognition..
On the other hand, PAE training courses will teach you to carry out advanced monitoring, in distributed architectures, and high availability environments, operate with plugins (server and agent) and use Pandora FMS monitoring policy system and manage Pandora FMS services.
Cyber Days Promotion: 25% off in packs
We’re going to show you our incredible promotion packs for the next Cyber Days, made up of the course taught, access to e-learning and the exams for the official certification.
Other options
But, we do not only offer packs, we also show you other options separately: the PAT/PAE exams, access to our e-learning platform and the magnificent and demanded customized courses, for specific needs. If you want to join the latter, first check with our professionals, since they cannot be taught online.
Our software
Many of you know our software, Pandora FMS. It is one of the most powerful and flexible ones out there in the market, and it offers several possibilities. Therefore, learning to master all its secrets is not easy task. On many occasions you need these courses. For this reason, this offer is a privileged opportunity to learn as much as possible about our tool.
The official Pandora FMS documentation reaches more than 1500 pages; you may read them, watch all our videos or even read the code; you may also count on extra help to save money and save your valuable time, but… who better than software developers to certify whether or not you master Pandora FMS?
Our official certifications not only show who deeply knows the product; They are also a way of finding out whether the person taking the course has really made the most out of it.
With almost a thousand certificates over the last decade, you can be sure that if someone is certified, they have enough knowledge to implement Pandora FMS.
If you have to monitor more than 100 devices, you may also enjoy a FREE 30-day Pandora FMS Enterprise TRIAL. Installation in Cloud or On-Premise, you choose !! Get it here.
Last but not least, remember that if you have a reduced number of devices to monitor, you can use the Pandora FMS OpenSource version. Find more information here.
Do not hesitate to send us your questions. Pandora FMS team will be happy to help you!
Data centers have become an essential element within new technologies, if we add to that the current capabilities of artificial intelligence we have a perfect, superhero pairing, capable of providing us with all kinds of advances and benefits. Yes, we can shout it to the wind: “Blessed is the time in which we live!”
The future: smart data centers
For artificial intelligence to be devoted to scaring us to death through iconic movies like 2001 or Terminator is a thing of the past, today it has other, much more interesting and practical purposes. For example, crowning itself by playing a fundamental role in data processing and analysis. Yes, that’s her, the futuristic AI, increasingly faster, more efficient and, now, necessary to manage data centers.
We know that data is already the element that moves the world. An essential requirement for any operation, be it institutional, business, commercial… This makes data centers one of the most important epicenters of digital transformation. After all, in their physical facilities you may find the equipment and technology that sustains, among other things, the information on which the world economy depends. Centers that store seamlessly data backup and recovery with just one hand, while supporting Cloud applications and transactions with the other. Therefore, they guarantee an ideal climate for investment and opportunities, they boost the economy and encourage and attract a large number of technology companies. They are almost the center of the digital revolution.
Although data centers are not without problems. It is estimated that in the future, three or four years from now, 80% of companies will close their traditional data centers. It’s not foresight madness if you consider the myriad of inconveniences traditional data centers face. I mean a certain lack of preparation for updates, infrastructure problems, environmental deficiencies, etc. But don’t worry, as for so many things, there is a vaccine, a remedy, to take advantage of the advances in artificial intelligence to improve, as far as possible, the functions and infrastructure of data centers.
Forbes Insights already pointed it out in 2020: AI is more than poised to have a huge impact on data centers. In its management, productivity, infrastructure… In fact, they already offer potential solutions to data centers to improve their operations. And data centers, already upgraded by artificial intelligence capabilities, process AI workloads more efficiently.
Power Usage Effectiveness, PUE
As you may guess, data centers consume a lot of energy, which is why an artificial intelligence network is necessary to increase the efficiency of energy use (PUE). The Power Usage Effectiveness or PUE, also equivalent to the total electrical power of the CPD or the total electrical power consumed by the systems, is a metric to calculate the efficiency of data centers.
A couple of years ago, Google was already able to achieve a consistent 40% reduction in the amount of energy used for cooling by deploying Deepmind IA in one of its facilities. This achievement equates to a 15% reduction in overall PUE overload, once electrical losses and other non-cooling issues have been accounted for. It produced the lowest PUE they had ever seen. And the thing is that Deepmind analyzes all kinds of variables within the data center to improve the efficiency of the energy used and reduce its consumption.
Can Smart Data Centers be threatened?
Yes, data centers can also suffer from cyber threats. Hackers do their homework, always finding new ways to breach security and sneak information from data centers. However, the IA once again shows its guts and resources, and learns from normal network behavior to detect threats based on possible irregularities in such behavior. Artificial intelligence can be the perfect complement to the current Security Incidents and Event Management (SIEM) systems, and analyze the inputs of the multiple systems and the incidents, devising an adequate response to each unforeseen event.
Effective management
Through the use of intelligent hardware and IoT sensors, artificial intelligence will show us the effective management of our data center infrastructure. It will automate repetitive work, for example. Activities such as temperature monitoring or the status of the equipment, security, risks of all kinds and the management of refrigeration systems. In addition to carrying out predictive analysis that will help distribute the work among the company’s servers. It will also optimize server storage systems and help find potential system failures, improve processing times, and reduce common risk factors.
AI systems have already been developed that automatically learn to schedule data processing operations on thousands of servers 20-30% faster, completing key data center tasks on the go twice as fast during times of high traffic. They handle the same or higher workload faster using fewer resources. Additionally, mitigation strategies can help data centers recover from data disruption. This immediately turns into a reduction in losses during the interruption and our customers giving us a wide smile of satisfaction.
Well, what do you think of this special union, this definitive combo that artificial intelligence and data centers are and will be? Do you think something can marinate better? Data centers and the Cloud ? N-Able and Kaseya? ,White wine and seafood? Condensed milk and everything else? Leave your opinion in the comments!
Would you like to find out more about what Pandora FMS can offer you? Find out clicking here . If you have to monitor more than 100 devices, you can also enjoy a FREE 30-day Pandora FMS Enterprise TRIAL. Installation in Cloud or On-Premise, you choose !! Get it here.
Last but not least, remember that if you have a reduced number of devices to monitor, you may use Pandora FMS OpenSource version. Find more information here .
Do not hesitate to send your questions. The great team behind Pandora FMS will be happy to assist you! And if you want to keep up with all our news and you like IT, release and, of course, monitoring, we are waiting for you in our blog and in our different social networks, from Linkedin to Twitter through the unforgettable Facebook . We even have a YouTube channel , and with the best storytellers. Ah well, we also have a new Instagram channel ! Follow our account, we still have a long way to go to match that of Billie Eilish.
“Adapt or die (and let others take your share of the cake)” is both an evolutionary law and a business law. Without going any further, today, the rise of new technologies and critical applications have led to a substantial change in data centers. It is natural of course, so much data, so much data generated by millions of Internet users wasting their time on the Internet… Data processing centers, or data centers, require new advances and solutions to be able to adapt to the processing of such an amount of information.
Therefore, current data centers are evolving, indeed, in response to this new situation. Improved facilities are now dedicated to supporting higher workloads and higher user traffic. We are talking about renewed systems and technological resources that grant a break, superior applications, shared data, flexibility, and high security for the protection of information.
The market is a jungle , and demand is continually stimulated by new proposals, models and skills that promise to renew the future of the data center. What are data centers evolving to? Let’s check out together some of the most in-demand competencies that will make data centers evolve in the coming future.
The work of data center technicians
Do not forget about them, in the end they are the ones responsible for data centers mostly. Installation, server and network computer maintenance, daily performance monitoring, maintaining a controlled and optimal equipment environment and solving all those unforeseen events that are usually associated with the network and servers. Not to mention the emergencies outside working hours, which will make them leave the shelter of their life as a civilian to go to repair any mess. Therefore, technicians from data centers will be a value to be taken into account by the market. Without a doubt they will take their chances on those that are the best and most prepared in the future. Computer support to staff and clients while they solve the bustle of servers and the network with the other hand. Their work is incalculable!
An architect in the Cloud
IT infrastructures and services in the Cloud, that is where money is invested, at least they are the two most notable factors companies want to take their chances on in recent times, and the appearance of 5G only reinforces their position. They take advantage of faster and more correct data transfers.
The data processing center, the technology company… absolutely everyone wants to focus now on the important factors that surround this investment: security in the Cloud and its architecture. They are looking for that revolutionary architect from the Cloud, with deep knowledge in the field, an architecture project up his sleeve and the final design of a unique product.
Hybrid management
Hyundai and its hybrid cars are not the only ones that have hybridization as their flag, there we have IT management that is also hybrid. Something unified to manage both the infrastructure in the Cloud and the traditional services. The benefits are many, including that hybrid IT management solutions provide key automation across IT functional areas. This encompasses service management, compliance, assurance, and governance.
And it is now that companies are using more AWS, Microsoft Azure and Google Cloud Platform, and other services in the Cloud, when IT administrators must guarantee network bandwidth between applications. Organizations will get into it more than ever.
Data center security
We live in a world where millions of users roam the Internet at ease, which makes managing and protecting data centers considerably more difficult. To ensure higher security, companies have to ensure their data and uninterrupted network performance. That’s why they hire fellow data analysts and cybersecurity architects skilled enough to look over the big picture and create a model of perception and protection against potential threats.
Edge computing
The arrival of edge computing certainly helps IT companies to collect and weigh information from IoT devices. They then transmit that data to a data center, be it remote or local. An edge server, as we know, differs from a source server in closeness to the client machine.
Edge servers store cache content in localized areas helping to ease server load. As the implementation of edge computing progresses, the thinking heads of data centers will look for talents with skills in networking, system design or database modeling and security.
Edge computing, security, hybrid management, architecture in The Cloud and specialized technicians are just some of the specialties towards which data centers are heading in their evolution. So if you are thinking of making a career out of it, this is the right time to rethink it. Ditch what you’re up to and join the demand around data centers. It is not Bitcoin, but it is undoubtedly a more consolidated bet.
Would you like to find out more about what Pandora FMS can offer you? Find out clicking here . If you have to monitor more than 100 devices, you can also enjoy a FREE 30-day Pandora FMS Enterprise TRIAL. Installation in Cloud or On-Premise, you choose !! Get it here.
Last but not least, remember that if you have a reduced number of devices to monitor, you may use Pandora FMS OpenSource version. Find more information here .
Do not hesitate to send your questions. The great team behind Pandora FMS will be happy to assist you! And if you want to keep up with all our news and you like IT, release and, of course, monitoring, we are waiting for you in our blog and in our different social networks, from Linkedin to Twitter through the unforgettable Facebook . We even have a YouTube channel , and with the best storytellers. Ah well, we also have a new Instagram channel ! Follow our account, we still have a long way to go to match that of Billie Eilish.
What is a CVE and why is it important for your security?
There are “good” hackers. They call themselves security analysts and some even devote their time to working for the common good. They investigate possible vulnerabilities in public and known applications, and when they find a possible security flaw that could endanger the users of those applications, they report that vulnerability to the software manufacturer. There is no reward, they are not paid for it, they do it to make the world safer.
What is a CVE?
This entire process, from the moment the manufacturer accepts the reported vulnerability until it is fixed, is taken to a public reference system called the CVE Database. This is a database maintained by MITRE Corporation (that’s why sometimes it is known as MITRE CVE list) with funds from the National Cyber Security Division of the government of the United States of America.
The CVE Program is an international effort, based on the community and it is based on it to discover vulnerabilities. Vulnerabilities are discovered, assigned and published in the CVE list.
Each CVE uniquely identifies a security problem. This problem can be of different types, but in any case, it is something that if it is not solved but rather stays hidden, someday someone will take advantage of said failure. A CVE simply describes which is the vulnerable application and the version and/or component affected without revealing sensitive information. When the error is corrected, it reports where the solution can be found. Generally a CVE is not made public until the mistake has been corrected, this is especially important, since it guarantees that the users of said application are not subjected to a gratuitous risk when publishing information about the failure. If there were no CVE, researchers would publish such information without coordinating with the manufacturers, producing unacceptable security risks for users who have no way to protect themselves against data that reveals security errors in their systems as users of those applications. Don’t forget that all software vendors have public CVEs published. Nobody is spared.
This consensus between manufacturers and researchers on the way to reveal sensitive information regarding security flaws of an application allows a continuous improvement of the security of public information systems. Although MITRE is originally a US funded organization, there are partner organizations around the world that help to organize CVEs regionally, decentralizing management and helping local manufacturers organize more efficiently.
INCIBE and ARTICA
CVEs are coordinated by CNAs, voluntary organizations that offer themselves to coordinate and resolve disputes when there are conflicting positions between security researchers and manufacturers. The root CNA is MITER, and there are CNAs spread all over the world. Most of the software and hardware manufacturers like Microsoft, CISCO, Oracle, VMware or Dell are CNAs that are part of the CVE program.
INCIBE, the National Cybersecurity Institute of Spain, is a Spanish organization that has recently become a CNA Root, a member with a special status within the CVE hierarchy, as it coordinates the Spanish CNAs. It is also a contact point in the country for receiving vulnerabilities discover n the IT domain, industrial systems and IoT (Internet of Things) devices.
Thanks to its collaboration with INCIBE, ÁRTICA the company behind Pandora FMS, Pandora ITSM and Pandora RC has become the official CNA of CVE. This is especially important as it shows Pandora FMS’s commitment to information system security and makes itself available to researchers from all over the world to work on solving any problem that may affect its users.
From this moment on, the program has two hundred one CNA from thirty two countries, ARTICA being number two hundred all over the world and third in Spain. After joining the program, ARTICA will be able to publicly receive any information related to the security of Pandora FMS, Pandora ITSM or Pandora RC and process the solution of the problem reliably as well as its public communication.
Our vulnerability management policy allows us to assure any Pandora FMS user that any problem will be dealt with rigorously, prioritizing the impact and mitigating risk in productive environments, while guaranteeing the researcher correct reception, communication and publication in the open of his/her work.
Vulnerability disclosure policy in Pandora FMS
At Pandora FMS, we have a very open policy in this regard. Pandora FMS was born with an open philosophy, this not only means open source, it also means free knowledge and, of course, process transparency. We have a fully public and transparent vulnerability disclosure policy. Over the years, different researchers have contacted us to report security problems in Pandora FMS. Yes, we too have had, and will have, security flaws. And thanks in part to the selfless work of security researchers, we have been correcting many of these flaws. We are so compliant and honest that we publish them ourselves in a list of known vulnerabilities on our own website.
Security bug reports generally have a life cycle that allows users to avoid the added risk of publishing information about software bugs ahead of time, before the manufacturer has been able to create a patch and distribute it in good time to its users. In this process, the security breach remains in a waiting stage, where the manufacturer accepts the reported problem and agrees on a date to solve the problem. The security researcher waits patiently and makes the solution of the problem as easy as possible: providing more information, collaborating with the development team, even doing some additional testing when the patch is available. The point is to work as a team to improve the robustness of the software.
The e-mail box [email protected] is open to anyone with an interest in improving the security of our software.
We would love to say that companies, above all else, value their employees, but it would be as naive as it is false. Yes, because at the top of the companies’ scale of values is data. The precious data. Data that actually only plays an important role when properly stored. And here is where the data warehouses come in.
What exactly is a data warehouse?
A data warehouse is actually a way of managing your data, specially designed, of course, to support business activities, especially those related to analytics. Enterprise data warehouses contain, of course, vast amounts of historical data to collate, query, pattern or analyze. These data, which the warehouse centralizes, come from a wide and different range of sources. We have the type: application log files, transaction applications, etc.
Apart from centralizing data and unifying their sources, data warehouses help in the decision-making process. This is because they contain valuable raw business knowledge. A very rich historical record for analysts and data experts. And from them, from the experts, we have taken the main advantages of data warehouses:
Source tracking and verification Thanks to data warehouses, we may trace the data to its source and verify both the information as well as the root it comes from. That way we will be able to store this source in our database and always ensure consistent and relevant information.
Sifting relevant data for companies. Once in the system, the quality and integrity of the data is guaranteed. Companies will only have useful data, those necessary for their activities, since the data warehouse format predisposes the analysis of their information at any time and under any circumstance. No one should any longer depend on a hunch or rash from the decision-maker, incomplete or poor quality data. The results will be fast and accurate.
In the data warehouse, the data is copied and processed, integrated and restructured, in advance, in a Semantic Data Store. This makes any analysis process much easier.
Imagine analyzing large amounts of data of all kinds and retrieving a value from them in a specific and precise way.
Types of data warehouses
If we strictly stick to company data warehouses, today we can have three main types:
Enterprise Data Warehouse (EDW): A data warehouse that contains the business data of a business and that includes all the information about its customers. It enables data analysis and can provide actionable insights. It also offers a unified approach to organizing and representing such data.
Operational Data Warehouse (ODS): We are faced with a central database that provides us with a snapshot of the freshest data from multiple transactional systems so that we can prepare operational reports. The ODS enables organizations to combine data in its original format, from several sources, to produce business reports.
Data market: It focuses on a single functional area of an organization and encompasses a subset of stored data. The data marketplace is specially designed for use by a specific department or set of users in an organization. We are talking about a condensed version of the data warehouse.
Small retrospective
Most would stop the clock on their time machine in 1980, where they believe that the concept of the data warehouse arises, but we would have to let it run a little further back, to the hippy sixties. When Dartmouth and Mills develop the term dimension and facts in a collaborative project.
Then we would advance to the seventies to witness how Nielsen and IRI introduce Dimensional Data Marts for retail sales, Tera Data Corporation launches a database management system prepared to help and assist in making decisions, and then, after a decade of progress, in the eighties, where the first implementation of a data warehouse emerged by the hand of Paul Murphy and Barry Devlin, IBM workers.
From the data warehouse to the Cloud?
As we have already seen in previous articles, the coronavirus pandemic that has devastated our planet has a lot to do with the new technological restructuring and with the religious ascents to the Cloud. It is also, of course, to blame for moving data warehouses to Cloud platforms.
On-premise data warehouses have great advantages: security, speed, etc. But they are not that elastic, and the foresight to determine how to scale the data warehouse, regarding future needs, is quite complex. During the famous Confinement, most moved to the Cloud and the data warehouses were going to follow their example of course. Even those in large companies, those who no one thought they could abandon their local data centers, are switching to the Cloud to make the most out of its advantages. That flexibility in computing and storage. Its ease of use, its versatile management and its profitability.
Tomorrow: Automation of the data warehouse
The list of issues a data warehouse deals with is still there: data integration, data views, data quality, optimization, competing methodologies, and so on. However, we can find an answer: warehouse automation..
With data warehouse automation, a data warehouse can use the latest technology for pattern-based automation and advanced design processes. This allows you to automate the planning, modeling and integration steps of the entire life cycle. We are faced with what seems like a very efficient alternative to traditional data warehouse design, one that reduces time-consuming tasks such as generating and deploying ETL codes on a database server.
After this long journey through the life and exploits of the data warehouses, we say goodbye, as you can see, focusing on the answers that it promises to give us in the near future. We will always be positive in the matter.
Would you like to find out more about what Pandora FMS can offer you? Find out clicking here . If you have to monitor more than 100 devices, you can also enjoy a FREE 30-day Pandora FMS Enterprise TRIAL. Installation in Cloud or On-Premise, you choose !! Get it here.
Last but not least, remember that if you have a reduced number of devices to monitor, you may use Pandora FMS OpenSource version. Find more information here .
Do not hesitate to send your questions. The great team behind Pandora FMS will be happy to assist you! And if you want to keep up with all our news and you like IT, release and, of course, monitoring, we are waiting for you in our blog and in our different social networks, from Linkedin to Twitter through the unforgettable Facebook . We even have a YouTube channel , and with the best storytellers. Ah well, we also have a new Instagram channel ! Follow our account, we still have a long way to go to match that of Billie Eilish.
Privacy policies in three other countries outside the EU
Are you not a little curious? Even a little bit, right under your chin or your temple about how they deal with privacy policies in other countries? Aren’t you? Well, surprise! Today, in Pandora FMS blog, we are going to get it out of our system by discussing how they do it, how they deal with the protection of international data and privacy, in at least three countries outside the European Community.
We are not going to choose countries at random, we leave that for a special of where we would go on vacation in Pandora FMS. The three countries we have chosen have one thing in common: they have initiated data protection reforms. They want to guarantee 100% the safety of their peers by offering them an improved data protection law.
This decision by these three countries is very likely due to the current pandemic, you know Covid-19 everywhere. With the almighty Internet as the systematic platform for sharing data, crooks had an obvious target. So in there we have been able to see, for some time now, countless data breaches and cybersecurity fraud. Therefore the demand for data security has proportionally generated concern and a large number of countries have decided, due to pressure, to reform their archaic and moth-eaten privacy and data protection policy frameworks. This is absolutely necessary. We have already seen it in film sagas such as James Bond or the Bourne Case, every country worth its salt handles sensitive data to protect.
Ó Pátria amada, idolatrada, salve, salve, Brasil.
We transport ourselves to the sunny and fine sands of the beaches of Brazil to find that the country approved the National Internet Law back in 2014, and that this same law defined the policies on data processing on the network. The strengths of this legislation considered consent as the strategy to follow and the fact that minors under 16 have restricted the exchange of personal data.
Brazil is currently preparing to introduce a new data protection plan through an ANPD (National Data Protection Authority). In fact, it has already published its normative strategy for the 2021-2023 fork. This ANPD wants to strengthen data protection in the country through the development of regulations, a new claim management for data breaches and adherence to the LGPD. These new privacy policies are not without certain similarities with the GDPR of our EU.
In case you didn’t quite understand the data, the LGPD is the General Law for the Protection of Personal Data, which we have among us since August 2020. Its function is to regulate the use and collection of personal data by all companies that do business and market in Brazil. It goes without saying that all these companies we are talking about must comply with the policies of the new law. Law that perfectly defines the penalties for violation and requires companies to comply with all its points. It also aims to give Brazilians some fundamental rights to improve their control over their data.
O Canada! Our home and native land!
The country of elk and maples has recently submitted different amendments to its data privacy law, now proposing the Consumer Privacy Protection Act (CPPA). Bill C-11, Digital Charter Implementation Law, replaces the previous data privacy law known as PIPEDA (Personal Information and Electronic Document Protection Law). Indeed, Canada, which has always strived, both to hunt down Bigfoot, and to ensure data privacy. Although it must be said that their legislative acts on the subject are sometimes limited to the private, commercial and institutional sectors. The power to enforce the rules of this law is shared between the Office of the Privacy Commissioner and the Court of Personal Information and Data Protection.
Article eight of this new law vows to protect citizens from unreasonable searches and seizures. The Consumer Privacy Protection Act also introduces restrictions on the collection, use and disclosure of personal information by any private entity and imposes high penalties for infringing it or failing to report an infringement.
This new law is based on the consent of citizens, but, to keep everyone happy, it also allows companies to use certain validation and consent strategies to collect personal data. Citizens may withdraw their consent in the future, if they wish, and request the deletion of their data.
Oh say, can you see, by the dawn’s early light…
There is no other way, unlike the most reasonable countries, the United States does not have a strict data privacy policy. What they actually have is a statewide compliance policy, which varies in rules, guidelines, and penalties. We are faced with several federal laws specific to each sector and with privacy laws, as we have said, at state level. Who regulates these privacy laws? Well, the thing is in the hands of the Federal Trade Commission.It is in California where we find ourselves with the strictest privacy policies. These policies give the individual the right to full transparency of the data used by companies and the provision not to disclose their data if they do not wish to do so.
Currently, there are many US states that are expanding their data policies. Since the pandemic, it is an unavoidable need.
Update or die, you know and especially regardingsecurity anddefense of our data. If you liked this article in which we visited different countries, leave us a comment, down there, with the country that you think has the highest data vulnerability and, why not?, the country you would go on a trip next year. I sincerely hope they don’t match.
Would you like to find out more about what Pandora FMS can offer you? Find out clicking here . If you have to monitor more than 100 devices, you can also enjoy a FREE 30-day Pandora FMS Enterprise TRIAL. Installation in Cloud or On-Premise, you choose !! Get it here .
Last but not least, remember that if you have a reduced number of devices to monitor, you can use the Pandora FMS OpenSource version. Find more information here .
Do not hesitate to send your inquiries. The great team behind Pandora FMS will be happy to assist you! And if you want to keep up with all our news and you like IT, release and, of course, monitoring, we are waiting for you in this our blog and in our different social networks, from Linkedin to Twitter through the unforgettable Facebook . We even have a YouTube channel , and with the best storytellers. Ah well, we also have a new Instagram channel ! Follow our account, we still have a long way to go to match that of Billie Eilish.
The fight of the century: Data Center VS Cloud! Let’s go!
In this blog we have always been eager for fights or competitions of whatever we please. We are like that, like fierce pokemon trainers who want to finally find out who has the greatest capabilities to win. They have praised us for it, they have hated us for it, but it does not matter, the point here is not having fun, but to give the most complete information about the litigants and the battle, so that the user can see closely who they should choose in the future. For all these reasons, today we have in our very own ring Data Center VS Cloud.
How to choose between a data center and Cloud storage?
When the decisive moment arrives, a company must decide about what it intends to do with data storage: “Do we send everything to the Cloud? Do we store our data right here, in our datacenter? Do we outsource them to a professional data center? After all, there are multiple factors, financial elements, the logistics of the company, different clauses and details. A lot of regulation to take into account that has you sweating when it comes to finding the correct answer.
The truth? In this article we are going to expose situations in which data centers beat the Cloud, because, for better or for worse, we are facing a foreseen victory.
Do you need more security?
It is true that the Cloud is no longer sooo in cloud 9 and both the Cloud and its computing and data storage solutions have made great progress in recent times. In fact, they offer a great infrastructure with protected access and the add-on of pay-as-you-go. But if you really want to have the appropriate protocols, compliance and security software, well, your data can be better and more secure in a data storage center, external or at home. There are many companies that offer external, professional and guaranteed data storage, which certifies that the information is your exclusive property and that the data will always be kept safe.
As we have said, storage security in IT Clouds is not as weak as some leaks of private pictures of celebrities have led us to believe. What’s more, the Cloud is often the first choice for a large number of companies, but there are certain nuances in Cloud storage that lead others to choose data centers. And there is a certain lack of control when choosing Cloud storage: problems with shared servers, lack of automatic backups, data leaks, fraudulent devices, vulnerable storage gateways, etc.
Combining infrastructure and profitability
If there is something that the clouds look like from the mainland, it is comfort and convenience, and so does the Cloud, something comfortable, agile… However, user fees can end up being quite expensive, depending on the type of services that one might need. An on-premise data center, in your own facilities, can also be one of the most expensive options, in addition that to manage it you must have a good security and IT team that takes care of regular updates and keeps it operational and always ready.
External storage might be the middle ground. Your own space within a data center or as part of a colocation package. If you think about it, you get the advantages of the Cloud without having to spend all that money that normally requires hosting data on a local data center. It is a very attractive option, considered by companies that have started getting consolidated and are now in full growth. Something more robust and reliable than the Cloud and without so many problems with the facilities.
Do you handle sensitive customer data?
Do you know when companies make up their minds quickly in this fierce fight between on-premise vs Cloud? When it comes to collecting, saving and using customer data that if leaked, lost or stolen would mean the destruction of their business, the private life of the person who trusted them or the public welfare in general. To give you an idea, Emperor Palpatine would never hang plans for The Death Star in the Cloud. Too risky.
Imagine then companies that compile and safeguard financial, political, medical, institutional, sensitive data… All of them choose to use physical data centers instead of the Cloud. And the same goes for telecommunications or social media companies. Physical centers are not the best thing ever, but the Cloud has proven itself more often to be vulnerable and easier to be violated more times.
You need a Cold Storage Location
When we talk about a Cold Storage Location we mean the storage of data that is completely offline, that is, they are not in the Cloud at all, they do not relate to the Cloud, they do not want the Cloud, they do not know what the Cloud is. Data is stored on safe physical means and then moved off-site in the event of a cataclysm. Like you know, a dana, a volcanic explosion, the Twister hurricane or a robbery attempt. This data storage option is often used by companies that have long-term compliance dates, financial institutions, brands threatened by ransomware attacks… They all see Cold Storage Location as the safest backup plan they can have.
Conclusion: Then, what about it?
Well, if we have to reach some conclusions, it must be said that storage in the Cloud is often convenient and has its place, but, of course, it is not the only option, nor is it the best for many companies. Data centers are the ones that best help companies, provide them with security, scalability and peace of mind. It is also the only alternative for companies looking for Cold Storage Location.
After this brawl, Cloud VS on-premise, you can take more into account the advantages and disadvantages of each one of them and make the best decision for your company and your customers’ data.
¿Quieres conocer mejor qué es lo que Pandora FMS puede ofrecerte? Descúbrelo entrando aquí. Si tienes que monitorizar más de 100 dispositivos también puedes disfrutar de un TRIAL GRATUITO de 30 días de Pandora FMS Enterprise. Instalación en Cloud u On-Premise, ¡¡tú eliges!! Consíguelo aquí.
Por último, recuerda que si cuentas con un número reducido de dispositivos para monitorizar puedes utilizar la versión OpenSource de Pandora FMS. Encuentra más información aquí.
Would you like to find out more about what Pandora FMS can offer you? Find out clicking here. If you have to monitor more than 100 devices, you may also enjoy a FREE 30-day Pandora FMS Enterprise TRIAL Installation in Cloud or On-Premise, you choose !! Get it here
Finally, remember that if you have a reduced number of devices to monitor, you can use the Pandora FMS OpenSource version. Find more information here.
Do not hesitate to send your inquiries. The great team behind Pandora FMS will be happy to assist you! And if you want to keep up with all our news and you like IT, release and, of course, monitoring, we are waiting for you in this our blog and in our different social networks, from Linkedin to Twitter through the unforgettable Facebook. We even have a YouTube channel , and with the best storytellers. Ah well, we also have a new Instagram channel! Follow our account, we still have a long way to go to match that of Billie Eilish.
We all remember a couple of biblical allegories here. That of the Good Samaritan, that of The Prodigal Son, that of an Aragonese with new Adidas and the trolleybus on line 8… But the one that interests us today is that of the most holy and bethlemite David, preceded by Saul and succeeded by Solomon, who, among his many achievements, managed to defeat the Philistine giant Goliath. And he did so despite their difference in size and strength, which comes close to explaining the potential of micro data centers compared to traditional data centers.
Micro data centers, small but actual beasts
Look in the rear-view mirror, an allegorical rear-view mirror of course, as it is very unlikely that you will find yourself driving while reading this brilliant article. Look in the rear view mirror. Far back on the road is the gray monotony of centralized data centers. Yes, given how new and cool cloud computing is, which companies are currently going for, data centers are becoming, in a subtle way, micro data centers. That is, smaller and more succinct versions of the system, the mechanics and the traditional apparatus.
These “mini versions”, compared to traditional data centers, are built for a different type of workload. In addition, they solve very specific problems that traditional data centers can no longer solve.
Macro qualities of a micro data center
If we go directly to the most common features, the most typical micro data center is around ten servers and one hundred virtual machines. They are autonomous systems that contain the same capabilities as traditional data centers and more. We are talking about refrigeration systems, security systems, humidity sensors and a constant power supply.
I no longer need you to look in the rearview mirror, now look at the front windshield. Due to the global pandemic of Covid-19, remote work or telework has become part of our lives permanently. Well, these micro data centers as small and cute as they come have been created as the ideal proposal for locations of all types. They can be deployed in a higher number of locations and rooms. Even for a rudimentary installation in a classic office, they are the most silent and functional ones.
More benefits of micro data centers
If we had to make an official list of benefits and advantages of our little David, the first thing we would point out, in bold type, is that micro data centers directly empower companies. And they do not do so by magic, they do it, for example, reducing server costs, since they do not require bulky storage, or giving the option to companies to upgrade according to their own needs. This already by itself supposes a substantial difference in costs that will come in handy for the development and growth of companies.
Micro data centers are closer to users, which also translates into a reduction in latency. All of that in addition to how cheap they are compared to traditional data centers.
If you keep on looking ahead the advances are coming, one after the other, like traffic signs that we quickly leave behind with our allegorical ride. Technology companies increasingly have more data to accumulate and are in need of more processing power. Big brands will have no problem, they have the money, but what about small offices, retail areas or even town firms? They more than anyone should take advantage of edge computing and micro data centers to improve their businesses. And not only because they have the strangest and most remote and forsaken locations, but because these micro data centers can run all kinds of security systems, cash registers and other digital systems that are usually needed by small businesses.
Imagine your neighborhood grocer, “Frank, The 6 fingers,” using data analytics to improve marketing. After all, micro data centers only need a comfortable cabinet for cooling. And if we are talking about a small savings bank or common bank, well, they can implement their financial practices making them more efficient with micro data centers. Leaning even towards IT solutions, edge computing, IoT…
But be careful: Micro data centers should not be mistaken with edge computing.
To avoid mistaking them: micro data centers take advantage of edge computing to reach their goal, while edge computing is the one that increases processing power, brings it closer to the data source, speeds up the process of transporting data and improves device performance.
Even if it was this time from 1 Samuel 17: 4-23; 21: 9, David blows up again and knocks out Goliath. Proving that the small can knock down the big one and that we all have a chance in this land of God, at least if we are seasoned enough and have a fighting spirit.
Would you like to find out more about what Pandora FMS can offer you? Find out clicking here . If you have to monitor more than 100 devices, you can also enjoy a FREE 30-day Pandora FMS Enterprise TRIAL. Installation in Cloud or On-Premise, you choose !! Get it here .
Last but not least, remember that if you have a reduced number of devices to monitor, you can use the Pandora FMS OpenSource version. Find more information here .
Do not hesitate to send your inquiries. The great team behind Pandora FMS will be happy to assist you! And if you want to keep up with all our news and you like IT, release and, of course, monitoring, we are waiting for you in this our blog and in our different social networks, from Linkedin to Twitter through the unforgettable Facebook . We even have a YouTube channel , and with the best storytellers. Ah well, we also have a new Instagram channel ! Follow our account, we still have a long way to go to match that of Billie Eilish.
A Service Level Agreement (SLA) is a document that details the expected level of service guaranteed by a vendor or product. This document generally sets out metrics such as uptime expectations and any payoffs if these levels are not met.
For example, if a provider advertises an uptime of 99.9% and exceeds 43 minutes and 50 seconds of service downtime, technically the SLA has been breached and the customer may be entitled to some type of remuneration depending on the agreement.
What do we want SLAs for?
A Service Level Agreement (SLA) specifies the quality of a service. It is a way of defining the limit of failures or times in which the response to a service is measured. Each service measures its quality in a different way, but in all cases it refers to times, and therefore it can be measured.
For example, if you worked in a restaurant, you would define your customer service SLA with several parameters:
Maximum time since a customer sits at the table and is served by a waiter.
Maximum time since you order the drink and it is served to you.
Maximum time since requesting the bill and paying.
Suppose that in our restaurant, we consider that the most important thing is the initial attention, and that no more than 60 seconds can go by, from when you sit down to when you are served. If we had a fully sensorized business with IoT technology, we could measure the time from when the customer sits at a table until a waiter approaches the table.
That way, we could measure the number of times each waiter manages to serve a customer in the established time. The way to do it can be more or less simple, but let’s keep it simple, suppose that every time they do it in less than 60 seconds they comply and when they do not make it, they do not comply. So if out of ten clients they serve in an hour, they fail only with two, they would be 80% compliant. We could make the average of their entire work day and thus easily compare different employees to find out which one has more “quality” in the metric of “serving a customer when they sit down.”
If we use a monitoring system, we could notify their manager every time that the overall quality of the service drops below 80% and by generating automatic reports, we could each month reward those with the best service compliance percentage and take measures (or fire) for those who are doing it worst.
One of the most important functions of monitoring systems is to measure. And measuring service compliance is essential if we care about quality. Whether we are on the provider side or on the client side.
If you are paying for a service, wouldn’t you like to check that you are actually getting what you pay for?
Sometimes we do well not to trust the measurements of others, and it is necessary to check it for “ourselves.” For this, monitoring tools such as Pandora FMS are essential.
What is the «uptime» or activity time?
Uptime is the amount of time that a service is available and operational. It is generally the most important metric for a website, online service, or web-based provider. Sometimes uptime is mistaken with SLA, but uptime is nothing more than a very common metric in online services that is used to measure SLAs, not an SLA, which as we have seen before is something much broader.
The trade-off is downtime – the amount of time a service is unavailable.
Uptime is usually expressed as a percentage, such as “99.9%”, over a specified period of time (usually one month). For example, an uptime of 99.9% equals 43 minutes and 50 seconds of inactivity.
What are the typical metrics of a supplier?
Those that are agreed between the supplier and the client. Each service will have its own metrics and indicators. Thus, in our Monitoring as a Service (MAAS) we can establish several parameters to be measured, among others, let’s see some of them to better understand how to «measure the service quality» through SLA:
Minimum response time to a new incident, 1 hr in standard service.
Critical incident resolution time: 6 hours in standard service.
Service availability time, 99.932% in the standard service.
When we talk about a time percentage, it generally refers to the annual calculation, so 99.932% corresponds to a total of 5h 57m 38s of service shutdown in a year. We can use our SLA calculator (below to test other percentages).
On the contrary, 1hr would be the inverse calculation, and for this we can use online tools such as uptime.is. By using it we will get that six hours would correspond to:
Weekly reporting: 99.405 %
Monthly reporting: 99.863 %
Quarterly reporting: 99.954 %
Yearly reporting: 99.989 %
Similarly to the initial waiter example, we can measure compliance with a support SLA by measuring the sum of several factors, if all are met, we are meeting the SLA, otherwise we’re not. This is how Pandora ITSM measures it, the helpdesk component integrated in Pandora FMS. Pandora FMS clients use Pandora ITSM for support, and thanks to it we can ensure that we attend to client requests on time.
How to calculate the service SLA time?
Use our online calculator to calculate a service downtime. For example, test 99.99% to see the maximum downtime for a day, a month, or the entire year.
How can Pandora FMS help with SLAs?
Pandora FMS has different tools to exhaustively control the SLAs of your client/supplier. You have SLA reports segmented by hours, days or weeks. That way you can visually assess where the defaults are.
This is an example of an SLA report in a custom time range (one month) with bands by ranges of a few minutes.
There are reports prepared to show the case of information sources with backup so that you can find out the availability of the service from the customer’s point of view and from the internal point of view:
This is an example of a monthly SLA view with detail by hours and days:
This is an example of a monthly SLA report view with a weekly view and daily detail:
This is an example of an SLA report view by months, with simple views by days:
Service monitoring
One of the most advanced functions of Pandora FMS is monitoring services with Pandora FMS. It is used to continuously monitor the status of a service, which, as we have seen at the beginning, is made up of a set of indicators or metrics. This service often has a series of dependencies and weightings (there are things more important than others) and all services have a certain tolerance or margin, especially if they are made up of many elements and some of these are redundant.
The best example is a cluster, where if you have ten servers, you know that the system works perfectly with seven of them. So the service as such can be operational with one, two or up to three machines failing.
In other cases, a service may have non-critical elements, which are part of the service and that we want to control, even if the service is not affected:
One of the advantages of service monitoring is that you can easily get the route to failure, literally being able to find the needle in the haystack. When you talk about technology, the source of a problem can be somewhat tiny compared to the amount of data you receive. Services help us determine the source of the problem and isolate ourselves from informational noise. They also allow to monitor the degree of service compliance in real time and take action before the quality of the service for a customer is affected.
On the way to perfecting its services, Pandora FMS launches one of the most advanced and complete solutions in its history as monitoring software: Monitoring as a Service (MaaS).
As we all know by now, Pandora FMS is a software for network monitoring that, among many other possibilities, allows visually monitoring the status and performance of several parameters from different operating systems (servers, applications, hardware systems, firewalls, proxies, databases, web servers, routers…). It can also be deployed on almost any operating system and has remote monitoring (WMI, SNMP, TCP, UDP, ICMP, HTTP …), etc.
But what concerns us this time is to see how Pandora FMS once again surpasses itself with Monitoring as a Service. Because yes!, it is time for you to have Pandora FMS ready to use and ready to cover all of your needs. Avoid, from now on, wasting valuable resources on installation, maintenance and operation, MaaS is fully intended as a flexible and easy-to-understand subscription model.
Monitoring as a Service (MaaS) advantages
In order not to roughly explain it in a rush, we better go into detail and list some of the most important advantages of Monitoring as a Service (MaaS).
With Monitoring as a Service, you do not need to invest in an operations center, or in an internal team of engineers to manage monitoring. That’s it, without capital expenditures (capex) or operating expenditures (opex).
With Pandora FMS as a Service monitoring you may accelerate the time to obtain values.
Available 24/7, access it anytime, anywhere. There are no downtimes associated with monitoring. Wonderful and available 24/7.
Generate alerts based on specific business conditions and discover the easy integration of this service with business processes.
Important: Permanent security. All information is protected, monitored and complies with GDPR.
Operation services, we can operate for you, saving resources and optimizing startup times.
Custom integrations, with Pandora FMS specialist consultants at your disposal.
Deployment projects, to support specialized resources wherever you need them.
Here is our proposal in more detail
What does this mean for your company or business?
Going straight to the point, Monitoring as a service (MaaS) provides unlimited scalability and instant access from anywhere and gets rid of worrying about maintaining storage, servers, backups, and software updates.
It is up to you to discover, right away, how the digital transformation of all business processes makes Monitoring as a Service (MaaS) an essential activity to boost the productivity of your company.
Some frequently asked questions about the solution (FAQ)
Of course, given such a technological scoop, you may have some doubts about the subject. Here we answer several of the most frequent questions that we were asked.
What agent limit does the service have? Does it have an alert or storage limit?
There is no agent limit, although the service starts from 100 agents. There is no limit on alerts or disk storage.
How long is history data stored?
45 days maximum. However, you may optionally hire a history data retention system to store data for up to two years.
What is the service availability? What happens if it crashes on a weekend?
The service availability SLA is 99.726% in Basic service, 99.932% in Standard service and 99.954% in Advanced service. In short, we will make sure it is never down.
In which country are the servers located?
We have several locations, to comply with different legislations, such as GDPR (EU), GPA (UK), CBPR (APEC) and CPA (California).
What security does the service offer?
In addition to an availability SLA guaranteed by contract, our servers are exclusive for each client, we have 24/7 monitoring, and our own system security. Of course, backup is included in the service.
How much does the service cost?
You pay a fee per month, which is calculated on the number of agents you are using that month. So if you increase the number of agents in a certain month, you will pay more that month. However, if you decrease the number of agents, you will pay less. There are also some start-up costs for the service and also some optional packages, such as if you want our engineers to develop a custom integration or help you deploy monitoring in your internal systems.
How is it billed?
Quarterly or semi-annually, with monthly cost calculations, so you can plan growth and costs without surprises.
What does the service include?
From Pandora FMS Enterprise license to the operating system, database management, system optimization, maintenance, updates, emergency patches, integration with Telegram and SMS sending, backup and recovery, preventive maintenance, environment security and any other technical task that may take up operating time. You will only have to operate with Pandora FMS.
What is the difference between Basic, Standard and Advanced services?
With the basic service, if you want to make a report or configure an alert, you can do it directly, without worrying about installing, configuring or parameterizing anything. In the Standard and Advanced service you can ask us to do it for you and we will be happy to do so, the same applies for building remote plugins, creating reports, users, policies, graphs or any other administrative Pandora FMS task. In the Standard and Advanced services you will have a number of hours of service each month for any request you may make, and our technical team will be at your disposal. Our technical team will be at your complete disposal.
What are the service hours?
Full office hours (from 9 AM to 6 PM) in America and Europe. From San Francisco to Moscow.
If you can no longer handle the intrigue and want to see how far the possibilities of Monitoring as a service go, you may now hire the solution through this link.
Would you like to find out more about what Pandora FMS can offer you? Find out clicking here . If you have to monitor more than 100 devices, you can also enjoy a FREE 30-day Pandora FMS Enterprise TRIAL. Installation in Cloud or On-Premise, you choose !! Get it here .
Last but not least, remember that if you have a reduced number of devices to monitor, you can use the Pandora FMS OpenSource version. Find more information here .
Do not hesitate to send your inquiries. The great team behind Pandora FMS will be happy to assist you! And if you want to keep up with all our news and you like IT, release and, of course, monitoring, we are waiting for you in this our blog and in our different social networks, from Linkedin to Twitter through the unforgettable Facebook . We even have a YouTube channel , and with the best storytellers. Ah well, we also have a new Instagram channel ! Follow our account, we still have a long way to go to match that of Billie Eilish.