Hi Buddies!
We are working hard in Pandora FMS 5.0 and one of the biggest points of this version is a renewed graphs system.
Until now the graphs could be static (pChart library) or flash (Fusion charts). The Flash ones has been replaced by a new library based on javascript/HTML5 using jQuery library.
I talk about Flot library.
With the new library we gain flexibility of customisation, interactivity and forget the heavy flash technology.
Some of the new features provided by this engine are:
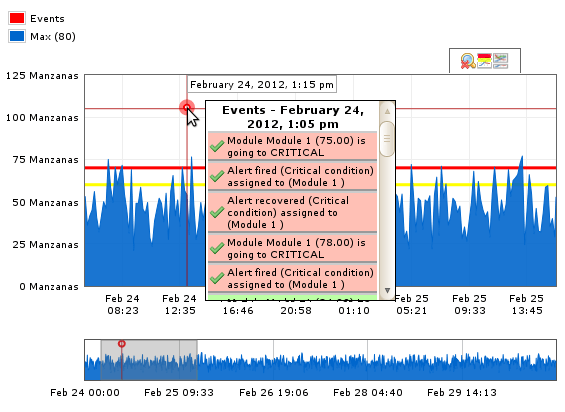
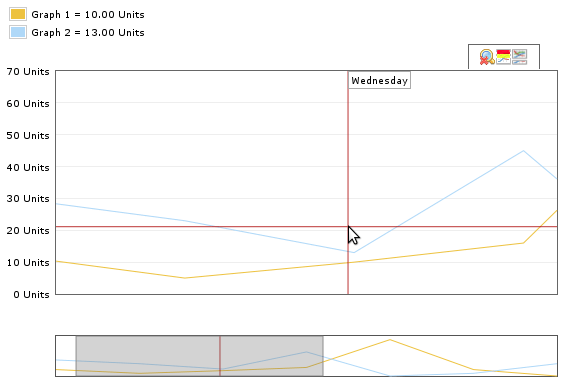
- Know the value of the graph (even combined graphs) updating legend when move the cursor over graph
- Zoom in possibility
- Overview graph to view full graph as reference when the main one is zoomed
- Warning and critical thresholds as yellow and red horizontal lines
- Draw events as points in the graph (until now the events was drawn as area graphs very ugly)
- Extend information of events through ajax call
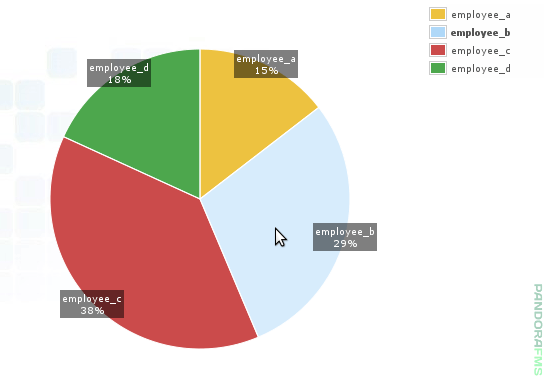
- Bold the legend item when the cursor is over a sector in pie graphs
- All flexibility that you imagination needs 🙂
Some screenshots:
Remember that YES… all of that is a completly OPEN feature.
You are welcomed to download the trunk version, test the graphs and play with it all you want.
Pandora FMS’s editorial team is made up of a group of writers and IT professionals with one thing in common: their passion for computer system monitoring. Pandora FMS’s editorial team is made up of a group of writers and IT professionals with one thing in common: their passion for computer system monitoring.


