


Graphs in Pandora FMS
Nowadays, the best way to resolve a technical problem in our systems or devices is to solve this problems even before it happens. Here is where a proper prevention system is required.
The prevention of problems in each electronic component nowadays is based upon our capabillity to monitor it, and understand the recollected information. In Pandora FMS we can observe the information in graphs.
Graphs are one of the most complex implementations on Pandora FMS. They gather information in real-time from the DB, and no external system is used (rrdtool or similar).
There are several behaviors of the graphs that depend on the type of the data:
- Asynchronous modules. It is assumed that there is no data compaction. Only the real samples of the data are stored (therefore, there is no compaction). This way more “exact” graphs are produced without possible misinterpretation.
- Text string modules. Shows the rate of the gathered data.
- Numerical modules. Most modules report such data.
- Boolean modules. These are numerical data on *PROC modules: for instance, ping checks, interface status, etc. 0 means wrong, 1 means “Normal”. Events are fired automatically when they change of state.
Compression
Compression affects on how the graphics are represented. When we receive two data with the same value, Pandora FMS doesn’t store the last data, but interprets that the last known value can be used for the present time if we don’t have another value. When a graph is being painted, if there isn’t a reference value just when the graphic starts, Pandora searches 48 hours back in time to find the last known value to take as reference. If it doesn’t find anything, it will start from 0.
In asynchronous modules, although there are not compression, the backwards search algorithm behaves similarly.
Interpolation
When composing a graph, Pandora FMS takes 50xN samples, being N the resolution factor of the graphs (this value can be configured in the setup). A monitor that gathers data every 300 seconds (5 minutes) will have 12 samples per hour, and 12×24 = 228 samples in a day. So when we ask a graph of a day, we are not printing 228 values, we are “compressing” or interpolating the graphic using only 50×3=150 samples (by default, graph resolution in Pandora FMS is 3).
This means that we lose some resolution and the more samples. When we have a lot of values, for instance the 2016 samples of a week, of 8400 samples of a month, we must compress them in the 150 samples of a graph. This is why sometimes we lose detail and do not see some details, that’s why the graphs can be queried with different intervals and to zoom in or out.
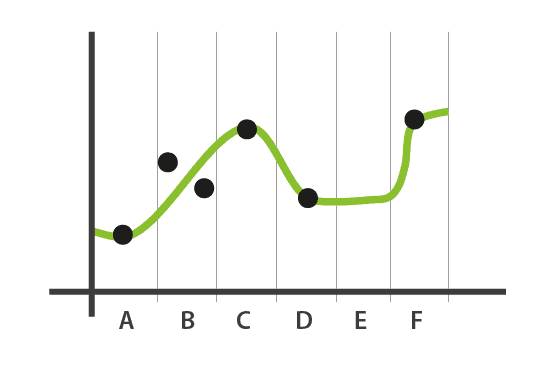 In the normal graphs, the interpolation is implemented in a simple way: if within an interval we have two samples (p.e: interval B of the example), we do the average and we draw its value.
In boolean graphs, if within a sample we have several data (we can only have 1 or 0), we take the pessimist approach, and draw 0. This helps for the visualization of failures within an interval, having priority showing the problem that the normal status.
In both cases, if within a sample we don’t have any data (because it’s compressed or because it’s missing), we will use the last known value of the previous interval to show the data, like the interval E of the above example shows.
Avg/Max/Min
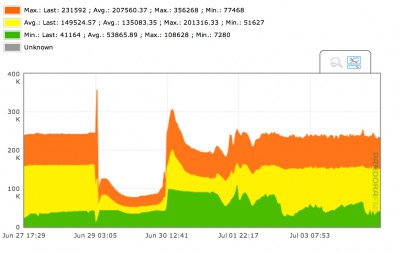
The graphs by default show the average, maximum and minimum values. Because a sample (see interpolation”) can have several data, we show the average values of the data, the maximum or the minimum.
The more interpolation needed (the longer the period we are visualizing and we have considerably more data), the higher the interpolation level will be, therefore the difference between maximum and minimum values will be greater. The lower the range of the graph (an hour or so), there will not be interpolation, or it will be minimum, so we’ll see the data with its “real” resolution, and the three series will be identical.
 |
|
| Do you want to know more about Pandora FMS? |
Do you want to get Pandora FMS? |
Pandora FMS’s editorial team is made up of a group of writers and IT professionals with one thing in common: their passion for computer system monitoring. Pandora FMS’s editorial team is made up of a group of writers and IT professionals with one thing in common: their passion for computer system monitoring.


